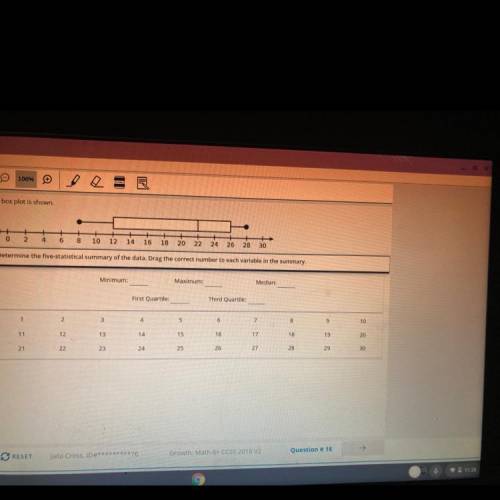
A box plot is shown
O
2
4
6
8
10
12
Determine the five-st...

Mathematics, 27.07.2021 19:40 yrodrig13
A box plot is shown
O
2
4
6
8
10
12
Determine the five-statistical summary of the data. Drag the correct number to each variable in the summary.
14
16
18
20
22 24 26
28
30
Minimum:
Maximum:
Median:
First Quartile:
Third Quartile:
1
2
3
4
11
5
12
6
ما تا ته
13
14
8
21
15
22
16
10
23
17
24
18
25
19
26
20
27
28
29
30
Please answer fast


Answers: 2


Other questions on the subject: Mathematics


Mathematics, 21.06.2019 20:00, lucerogon7403
How can you construct perpendicular lines and prove theorems about perpendicular lines
Answers: 3

Mathematics, 21.06.2019 23:00, mattdallas6214
Type the correct answer in each box. use numerals instead of words. the average number of subscribers to an online magazine each year from 2010 to 2015 is given in the table below. the average number of subscribers to the online magazine in 2010 was the percent increase in the average number of subscribers in 2011 to the average number of subscribers in 2012 was %. the maximum average number of subscribers to the online magazine in the years shown was
Answers: 2

Mathematics, 21.06.2019 23:30, travawnward
What is the ratio for the surface areas of the cones shown below, given that they are similar and that the ratio of their radii and altitudes is 2: 1? submit
Answers: 1
You know the right answer?
Questions in other subjects:

Spanish, 02.08.2021 23:50


Mathematics, 02.08.2021 23:50

Mathematics, 02.08.2021 23:50

English, 02.08.2021 23:50


Chemistry, 02.08.2021 23:50


Social Studies, 02.08.2021 23:50


