
Mathematics, 27.07.2021 17:50 sanchitcoolcham7362
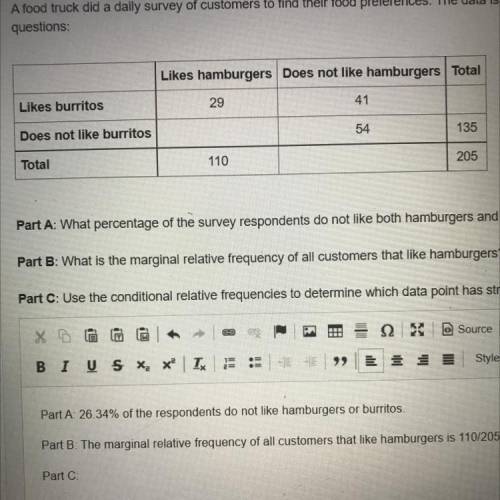
A food truck did a daily survey of customers to find their food preferences. The data is partially entered in the frequency table. Complete the table to analyze the data and answer the Questions.
Likes hamburgers
Does not like hamburgers Total
Likes burritos
29
41
Does not like burritos
54
135
Total
110
205
Part A:What percentage of the survey respondents do not like both hamburgers and burritos?
Part B:
What is the marginal relative frequency of all customers that like hamburgers?
Part C.
Use the conditional relative frequencies to determine which data point has strongest association of its two factors. Use complete sentences to explain your answer.

Answers: 2


Other questions on the subject: Mathematics
Mathematics, 21.06.2019 14:00, coltonduggan
Aright triangle has an area of 18 square inches. b: if the triangle is not an isosceles triangle, what are all the possible lengths of the legs, if the lengths are whole numbers. answer !
Answers: 1
Mathematics, 21.06.2019 19:00, naomicervero
Four individuals pool money together to start a new business and agree to split the profits equally. n invests $6,000, x invests $2,000, y invests $8,000 and z invests $4,000. if the profits for the first month were $100,000, y receives than if the profits were divided in proportion to how much they invested.
Answers: 3
You know the right answer?
A food truck did a daily survey of customers to find their food preferences. The data is partially e...
Questions in other subjects:


Biology, 17.04.2020 06:10


History, 17.04.2020 06:10
SAT, 17.04.2020 06:11


