
Mathematics, 26.07.2021 23:10 badaxz
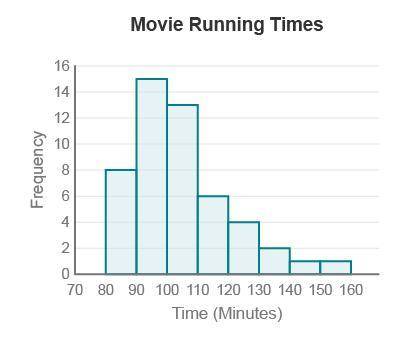
Alex records the running time—the number of minutes a movie lasts from start to finish—of 50 popular movies. The distribution of times, in minutes, is displayed in the histogram below.
A histogram titled Movie running times has time (minutes) on the x-axis and frequency on the y-axis. 80 to 90, 8; 90 to 100, 15; 100 to 110, 13; 110 to 120, 6; 120 to 130, 4; 130 to 140, 2; 140 to 150, 1; 150 to 160, 1.
Which of the following correctly describes the shape of the distribution?
uniform
skewed left
skewed right
roughly symmetric
I think its skewed right, (C) can someone check?

Answers: 2


Other questions on the subject: Mathematics
Mathematics, 21.06.2019 18:00, evarod
The given dot plot represents the average daily temperatures, in degrees fahrenheit, recorded in a town during the first 15 days of september. if the dot plot is converted to a box plot, the first quartile would be drawn at __ , and the third quartile would be drawn at link to the chart is here
Answers: 1
Mathematics, 21.06.2019 20:50, kassandramarie16
Amanda went into the grocery business starting with five stores. after one year, she opened two more stores. after two years, she opened two more stores than the previous year. if amanda expands her grocery business following the same pattern, which of the following graphs represents the number of stores she will own over time?
Answers: 3
Mathematics, 21.06.2019 22:20, sethlynn2003
Question 5 of 10 2 points if a population is a sample of the population could be a. registered voters; all citizens o o b. baptists; all religious people o c. people who purchased shoes; all customers o d. the entire school faculty; math teachers
Answers: 3
You know the right answer?
Alex records the running time—the number of minutes a movie lasts from start to finish—of 50 popular...
Questions in other subjects:


Mathematics, 14.03.2020 04:59


