
Mathematics, 26.07.2021 23:10 jhitotw
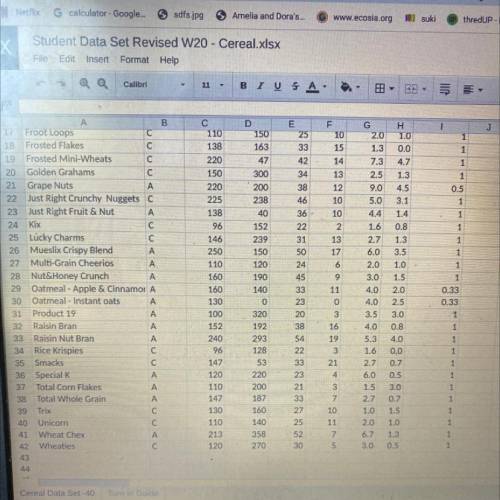
(PLEASE HELP) I need to create a double bar histogram comparing children’s cereal to adults cereal. I will attach the data in a picture.

Answers: 2


Other questions on the subject: Mathematics
Mathematics, 21.06.2019 16:30, SKYBLUE1015
Which elements in the set below are integers? 12, –3⁄4,√ 25 , –7, √ 5 , 14⁄7, 9 a. 12, √ 25 , –7, 9 b. 12, √ 25 , –7, 14⁄7, 9 c. –3⁄4, 25 , √ 5 ,14⁄7 d. 12, –7, 9
Answers: 2
Mathematics, 21.06.2019 21:30, shymitch32
Create a graph for the demand for starfish using the following data table: quantity/price of starfish quantity (x axis) of starfish in dozens price (y axis) of starfish per dozen 0 8 2 6 3 5 5 2 7 1 9 0 is the relationship between the price of starfish and the quantity demanded inverse or direct? why? how many dozens of starfish are demanded at a price of five? calculate the slope of the line between the prices of 6 (quantity of 2) and 1 (quantity of 7) per dozen. describe the line when there is a direct relationship between price and quantity.
Answers: 3
You know the right answer?
(PLEASE HELP)
I need to create a double bar histogram comparing children’s cereal to adults cereal....
Questions in other subjects:

History, 18.09.2021 08:00
Mathematics, 18.09.2021 08:00

Social Studies, 18.09.2021 08:00

English, 18.09.2021 08:00

Biology, 18.09.2021 08:00

Physics, 18.09.2021 08:10
Mathematics, 18.09.2021 08:10
Mathematics, 18.09.2021 08:10
English, 18.09.2021 08:10


