
Mathematics, 26.07.2021 23:00 damilysgonzalez2
3.
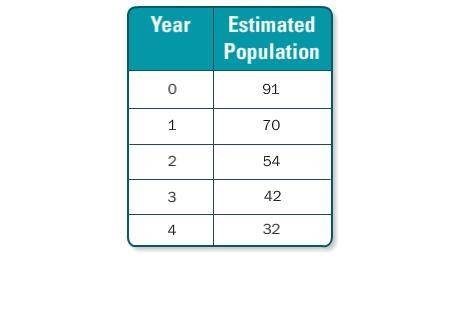
The table shows the estimated number of deer living in a forest over a five-year period. Are the data best represented by a linear, exponential, or quadratic model? Write an equation to model the data.
A. quadratic; y = 91x2 + 0.77
B. exponential; y = 91 • 0.77x
C. linear; y = 0.77x + 91
D. quadratic; y = 0.77x2 + 91

Answers: 2


Other questions on the subject: Mathematics
Mathematics, 21.06.2019 18:00, gyexisromero10
The estimated number of people to attend the last bengals game of the season was 2000. the actual number of fans attending was 1200. by what percent did the estimate differ from the actual?
Answers: 3
Mathematics, 21.06.2019 19:30, cody6187
Agroup of randomly selected apple valley high school students were asked to pick their favorite gym class. the table below shows the results of the survey. there are 528 students at apple valley high school. gym class number of students racquet sports 1 team sports 9 track and field 17 bowling 13 based on the data, what is the most reasonable estimate for the number of students at apple valley high school whose favorite gym class is bowling? choose 1 answer a. 9 b. 13 c. 119 d. 172
Answers: 1
You know the right answer?
3.
The table shows the estimated number of deer living in a forest over a five-year period. Are the...
Questions in other subjects:

Business, 15.07.2019 10:30

Mathematics, 15.07.2019 10:30


Social Studies, 15.07.2019 10:30

History, 15.07.2019 10:30
History, 15.07.2019 10:30
History, 15.07.2019 10:30


