
Mathematics, 26.07.2021 15:20 raylynnreece4939
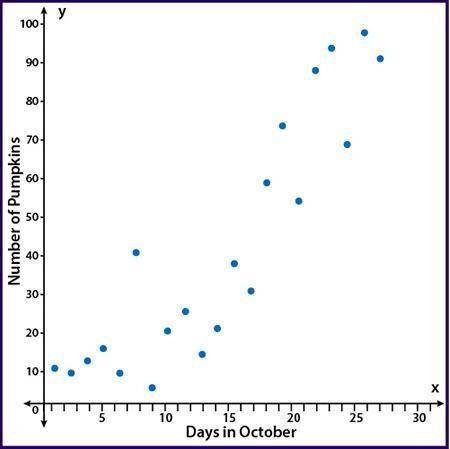
The scatter plot shows the number of pumpkins that have been picked on the farm during the month of October:
Part A: Using computer software, a correlation coefficient of r = 0.51 was calculated. Based on the scatter plot, is that an accurate value for this data? Why or why not? (5 points)
Part B: Instead of comparing the number of pumpkins picked and the day in October, write a scenario that would be a causal relationship for pumpkins picked on the farm. (5 points)

Answers: 2


Other questions on the subject: Mathematics
Mathematics, 21.06.2019 15:00, ladnerhailey16
Pj is decorating pupcakes for rocky's birthday party. her color scheme is black, purple, and green. she will use this spinner to determine the color of sprinkles on each pupcake. which model shows the probability of randomly landing on each color?
Answers: 3
Mathematics, 21.06.2019 19:00, lashaeperson
How does a low unemployment rate affect a nation's economy? a. the nation has a higher number of productive resources. b. the nation can spend more money on for unemployed people. c. the nation can save money by paying lower salaries to a large workforce. reset
Answers: 1
Mathematics, 21.06.2019 22:30, pedroramirezr2
What is the graph of the absolute value equation ? y=|x|-5
Answers: 1
You know the right answer?
The scatter plot shows the number of pumpkins that have been picked on the farm during the month of...
Questions in other subjects:
Mathematics, 20.09.2020 15:01

Mathematics, 20.09.2020 15:01
Mathematics, 20.09.2020 15:01

English, 20.09.2020 15:01


