
Mathematics, 25.07.2021 14:00 brinks7994
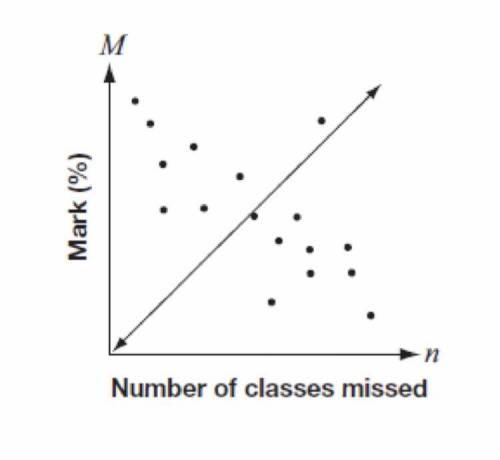
15. Mary was given data comparing students’ mark in math class and the number of classes missed. She plotted the data on the graph below and drew a line of best fit. Do you agree with Mary’s drawing of the line of best fit? Justify your answer

Answers: 3


Other questions on the subject: Mathematics
Mathematics, 21.06.2019 19:00, asmith219771
What is the expression in factored form? -20x^2 - 12x a. 4x(5x+3) b. -4x(5x-3) c. -4(5x+3) d. -4x(5x+3)
Answers: 2
Mathematics, 21.06.2019 19:30, jasminetaylor4587
According to the data set, where should the upper quartile line of the box plot be placed?
Answers: 1
Mathematics, 21.06.2019 20:00, adriancastaneda
The radius of the earth is two times the radius of the moon. what fraction of the volume of the earth is the volume of the moon?
Answers: 1
Mathematics, 22.06.2019 02:00, DESIREEHANCOTTE10
Add. express your answer in simplest form. 12 9/10+2 2/3 = i need u guys to me find the answer to this question
Answers: 1
You know the right answer?
15. Mary was given data comparing students’ mark in math class and the number of classes missed. She...
Questions in other subjects:
Mathematics, 27.03.2020 23:18


History, 27.03.2020 23:18
History, 27.03.2020 23:18
Mathematics, 27.03.2020 23:18

English, 27.03.2020 23:18
Mathematics, 27.03.2020 23:18


