
Mathematics, 24.07.2021 14:40 chloegrace359
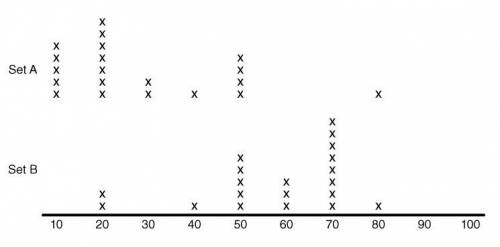
The following dot plot represents two data sets, A and B. The mean of set B is about _ (40, 50, 30) higher than the means of set A, which is about _ (half, twice, the same as) the mean absolute deviation of either set.

Answers: 1


Other questions on the subject: Mathematics
Mathematics, 21.06.2019 18:30, hsjsjsjdjjd
Iam a rectangle. my perimeter is 60 feet. how much are do i cover?
Answers: 1
Mathematics, 21.06.2019 18:30, pacerskora
Write an algebraic expression to match each statement a. four less than 8 times a number b. twice the difference of a number and six c. nine from a number squared
Answers: 1
Mathematics, 21.06.2019 22:00, MoparorNocar061401
Find two numbers if their sum is 91 and the ratio is 6: 7?
Answers: 1
You know the right answer?
The following dot plot represents two data sets, A and B.
The mean of set B is about _ (40, 50, 30)...
Questions in other subjects:

English, 07.08.2021 01:00

Social Studies, 07.08.2021 01:00
English, 07.08.2021 01:00
Mathematics, 07.08.2021 01:00


