
Mathematics, 22.07.2021 22:20 unruhlsY25
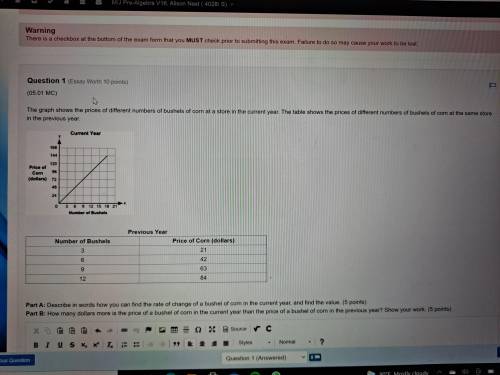
The graph shows the prices of different numbers of bushels of corn at a store in the current year. The table shows the prices of different numbers of bushels of corn at the same store in the previous year.
A graph shows Number of Bushels on x-axis and Price of Corn in dollars on y-axis. The x-axis scale is shown from 0 to 21 at increments of 3, and the y-axis scale is shown from 0 to 168 at increments of 24. A straight line joins the ordered pairs 3, 24 and 6, 48 and 9, 72 and 12, 96 and 15, 120 and 18, 144.
Previous Year
Number of Bushels
Price of Corn (dollars)
3
21
6
42
9
63
12
84
Part A: Describe in words how you can find the rate of change of a bushel of corn in the current year, and find the value. (5 points)
Part B: How many dollars more is the price of a bushel of corn in the current year than the price of a bushel of corn in the previous year? Show your work. (5 points)

Answers: 2


Other questions on the subject: Mathematics
Mathematics, 21.06.2019 22:30, muziqbox594
What is the name of a polygon that has four congruent sides and theses angle measures 60,120,60,120?
Answers: 1
Mathematics, 21.06.2019 23:00, hjeffrey168
Evaluate each expression. determine if the final simplified form of the expression is positive or negative -42 (-4)2 42
Answers: 2
You know the right answer?
The graph shows the prices of different numbers of bushels of corn at a store in the current year. T...
Questions in other subjects:


