
Mathematics, 22.07.2021 18:00 janeou17xn
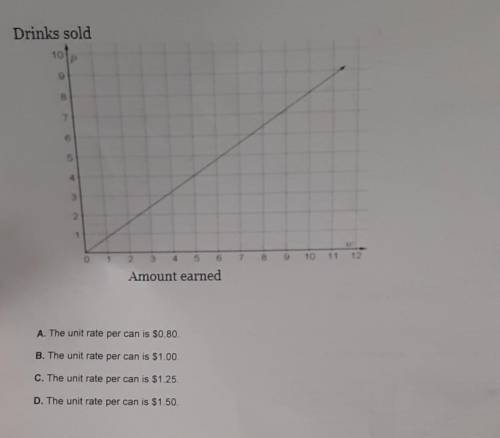
11. Jonathan Cole drew the graph below to show the amount he earned in can drink sales. Which unit rate best describes Jonathan Cole's graph?

Answers: 3


Other questions on the subject: Mathematics
Mathematics, 21.06.2019 23:40, averycipher
Which point-slope form equation represents a line that passes through (3,-2) with a slope of -4/5
Answers: 1
Mathematics, 22.06.2019 00:30, student176
Will mark 50 show all what is the solution to the system of equations? use the substitution method and show your work. -5x+y= -3 -15 x+3y=7 explain what your answer in part (a) tells you about the association of the lines in this system.
Answers: 1
You know the right answer?
11. Jonathan Cole drew the graph below to show the amount he earned in can drink sales. Which unit r...
Questions in other subjects:

Mathematics, 25.06.2021 01:00

Mathematics, 25.06.2021 01:00

Spanish, 25.06.2021 01:00
Mathematics, 25.06.2021 01:00


