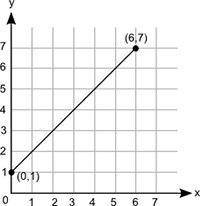
So basically, the initial value is just the value of y when x is zero. In this case, its 1 this point on the graph where x=0 is also known as the y intercept. Hope that helped.
List x1, x2, x3, x4 where xi is the midpoint endpoint of the five equal intervals used to estimate the area under the curve of f(x) between x = 0 and x = 10.