
Mathematics, 21.07.2021 21:40 PSAP17
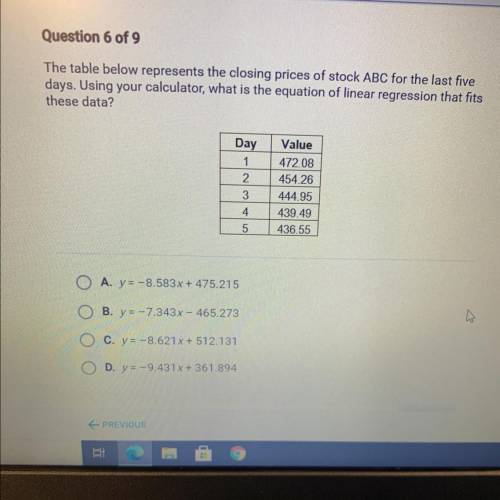
The table below represents the closing prices of stock ABC for the last five
days. Using your calculator, what is the equation of linear regression that fits
these data?
Day
1
2
3
Value
472.08
454.26
444.95
439.49
436.55
4
5
O
A. y = -8.583x + 475.215
B. y = -7.343x - 465.273
c. y = -8.621x + 512.131
D. Y = -9.431x + 361.894

Answers: 2


Other questions on the subject: Mathematics
Mathematics, 21.06.2019 16:20, bestballer7095
Aclass consists of 55% boys and 45% girls. it is observed that 25% of the class are boys and scored an a on the test, and 35% of the class are girls and scored an a on the test. if a student is chosen at random and is found to be a girl, the probability that the student scored an ais
Answers: 2
Mathematics, 21.06.2019 19:30, AriesTwice
Acollection of coins has value of 64 cents. there are two more nickels than dimes and three times as many pennies as dimes in this collection. how many of each kind of coin are in the collection?
Answers: 1
Mathematics, 21.06.2019 20:00, trevorhenyan51
Ahiker stands at an unknown elevation before he ascends 2 miles up a mountain to an elevation of 9 miles. find the elevation of the hiker before his ascent.
Answers: 1
You know the right answer?
The table below represents the closing prices of stock ABC for the last five
days. Using your calcu...
Questions in other subjects:

Chemistry, 28.03.2021 22:10


Mathematics, 28.03.2021 22:10

English, 28.03.2021 22:10
Mathematics, 28.03.2021 22:10


