B. 0 ≤ y ≤ 5

Mathematics, 20.07.2021 19:10 joselinegarciaowyrpf
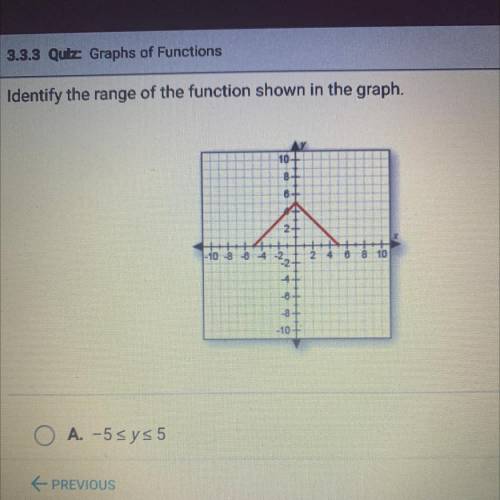
Identify the range of the function shown in the graph.
A. − 5 ≤ y ≤ 5
B. 0 ≤ y ≤ 5
C. y is all real numbers.
D. y > 0
Please answer thanks.

Answers: 1


Other questions on the subject: Mathematics
Mathematics, 21.06.2019 12:30, 101EXPERIENCE
Iam so stuck. what is the worked out answer for this question?
Answers: 1
Mathematics, 21.06.2019 19:00, alkaline27
Amodel rocket is launched from a roof into a large field. the path of the rocket can be modeled by the equation y = -0.04x^2 + 8.6x + 4.8, where x is the horizontal distance, in meters, from the starting point on the roof and y is the height, in meters, of the rocket above the ground. how far horizontally from its starting point will the rocket land? a. 0.56 m b. 215.56 m c. 431.11 m d. 215.74 m
Answers: 1
Mathematics, 21.06.2019 20:00, Ap621765
In one day there are too high tides into low tides and equally spaced intervals the high tide is observed to be 6 feet above the average sea level after six hours passed a low tide occurs at 6 feet below the average sea level in this task you will model this occurrence using a trigonometric function by using x as a measurement of time assume the first high tide occurs at x=0. a. what are the independent and dependent variables? b. determine these key features of the function that models the tide: 1.amplitude 2.period 3.frequency 4.midline 5.vertical shift 6.phase shift c. create a trigonometric function that models the ocean tide for a period of 12 hours. d. what is the height of the tide after 93 hours?
Answers: 1
You know the right answer?
Identify the range of the function shown in the graph.
A. − 5 ≤ y ≤ 5
B. 0 ≤ y ≤ 5
B. 0 ≤ y ≤ 5
Questions in other subjects:
Mathematics, 10.02.2022 07:10

Social Studies, 10.02.2022 07:10


Mathematics, 10.02.2022 07:10
Mathematics, 10.02.2022 07:10


