
Mathematics, 16.07.2021 09:20 jcollings44
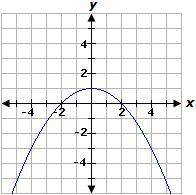
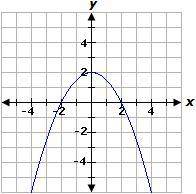
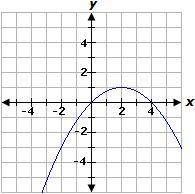
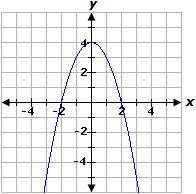
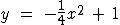
Select the correct answer. Select the graph of the equation below. A. B. C. D.

Answers: 3


Other questions on the subject: Mathematics
Mathematics, 21.06.2019 15:30, nayelimoormann
Turner's mom measured his room to see how long the wallpaper border needed to be. if two walls are 15 feet long and two walls are 12 feet long, how long should the strip of border be cut?
Answers: 1
Mathematics, 21.06.2019 20:00, duhitzmay4693
The scatterplot below shows the number of hours that students read weekly and the number of hours that they spend on chores weekly. which statement about the scatterplot is true?
Answers: 2
Mathematics, 21.06.2019 21:30, gonzalezashley152
In a test for esp (extrasensory perception), the experimenter looks at cards that are hidden from the subject. each card contains either a star, a circle, a wave, a cross or a square.(five shapes) as the experimenter looks at each of 20 cards in turn, the subject names the shape on the card. when the esp study described above discovers a subject whose performance appears to be better than guessing, the study continues at greater length. the experimenter looks at many cards bearing one of five shapes (star, square, circle, wave, and cross) in an order determined by random numbers. the subject cannot see the experimenter as he looks at each card in turn, in order to avoid any possible nonverbal clues. the answers of a subject who does not have esp should be independent observations, each with probability 1/5 of success. we record 1000 attempts. which of the following assumptions must be met in order to solve this problem? it's reasonable to assume normality 0.8(1000), 0.2(1000)%30 approximately normal 0.8(1000), 0.2(1000)% 10 approximately normal srs it is reasonable to assume the total number of cards is over 10,000 it is reasonable to assume the total number of cards is over 1000
Answers: 1
Mathematics, 21.06.2019 22:50, sarbjit879
Which linear inequality is represented by the graph?
Answers: 1
You know the right answer?
Select the correct answer. Select the graph of the equation below. A. B. C. D.
Questions in other subjects:

Mathematics, 21.04.2020 17:19


