
Mathematics, 14.07.2021 06:00 vavery61
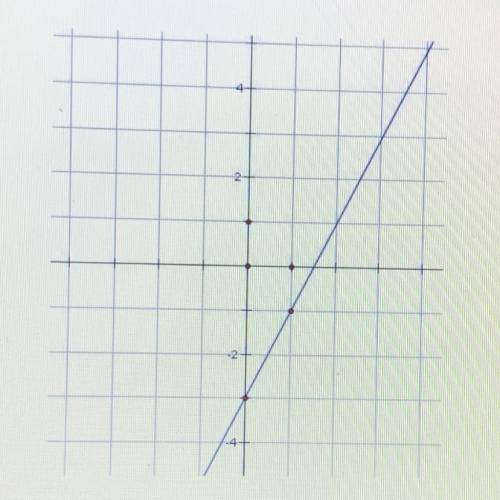
The graph shown models a linear relation. Use the graph to answer the following questions. The two known points are (0, -3) and (1, -1)
1. What is the value of the dependent variable if the value of the independent variable is 3?
2. Predict the value of the independent variable when the dependent variable is -5.

Answers: 3


Other questions on the subject: Mathematics
Mathematics, 21.06.2019 22:00, sebcbal
The mean finish time was 185.52 with a standard deviation of 0.327 minute. the winning car driven by chris finished in 185.13. the previous year race had a mean finish time of 110.3 with a standard deviation of 0.106. the winning car that year driven by karen finished in 110.13 minutes. find their respective z-scores. chris - z-score karen “- z-score
Answers: 1
Mathematics, 22.06.2019 01:20, katherinevandehei
Construct a box plot to represent the ages of the actors in a play. step 1: arrange the numbers in order from lowest (on the left) to highest. 24 18 30 26 24 33 32 44 25 28
Answers: 3
You know the right answer?
The graph shown models a linear relation. Use the graph to answer the following questions. The two k...
Questions in other subjects:
Mathematics, 25.05.2021 19:10
Mathematics, 25.05.2021 19:10

Mathematics, 25.05.2021 19:10
Mathematics, 25.05.2021 19:10

Chemistry, 25.05.2021 19:10


