
Mathematics, 14.07.2021 04:30 Seena912
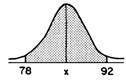
The shaded area in the distribution below represents approximately 95% of the data. Use the diagram to find the mean and the standard deviation.

Answers: 2


Other questions on the subject: Mathematics
Mathematics, 21.06.2019 15:00, gabbyypadron
What are the relative frequencies to the nearest hundredth of the columns of the two-way table? a b group 1 102 34 group 2 18 14
Answers: 1
Mathematics, 21.06.2019 17:10, shayneseaton
Find the value of x for which the lines are parallel.
Answers: 1
Mathematics, 21.06.2019 19:50, itsmariahu1927
Which statement is true? n is a point of tangency on circle p. pt is a secant of circle p. is a secant of circle p. vu is a tangent of circle p.
Answers: 3
You know the right answer?
The shaded area in the distribution below represents approximately 95% of the data. Use the diagram...
Questions in other subjects:


English, 05.07.2019 23:30


