
Mathematics, 13.07.2021 22:30 hellokitty1647
Directions: Complete the task below.
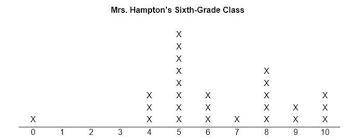
in Mrs. Hampton’s sixth-grade class. The results are shown in the dot plot below.
Step 1: Collect and Record Your own data! Ask exactly 25 people the same question as above (How many movies did you see in the last month). Record your data and create a dot plot showing your results.

Answers: 3


Other questions on the subject: Mathematics
Mathematics, 21.06.2019 16:20, whitneyt3218
7.(03.01 lc)which set represents the range of the function shown? {(-1, 5), (2,8), (5, 3), 13, -4)} (5 points){-1, 2, 5, 13){(5, -1), (8, 2), (3,5), (-4, 13)){-4, 3, 5, 8}{-4, -1, 2, 3, 5, 5, 8, 13}
Answers: 3
Mathematics, 22.06.2019 00:00, GERIANNCAYER
Aclothing designer is selecting models to walk the runway for her fashion show. the clothes she designed require each model’s height to be no more than y inches from 5 feet 10 inches, or 70 inches. which graph could be used to determine the possible variance levels that would result in an acceptable height, x?
Answers: 2
You know the right answer?
Directions: Complete the task below.
in Mrs. Hampton’s sixth-grade class. The results are shown in...
Questions in other subjects:

Social Studies, 07.12.2020 23:40
Mathematics, 07.12.2020 23:40

Mathematics, 07.12.2020 23:40

English, 07.12.2020 23:40
Mathematics, 07.12.2020 23:40


