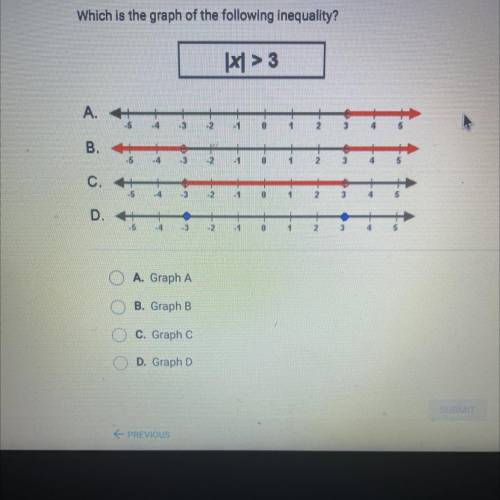
Which is the graph of the following inequality?
|* > 3
A.
.
43
2
1...

Mathematics, 13.07.2021 19:20 s9003792
Which is the graph of the following inequality?
|* > 3
A.
.
43
2
1
0
1
2
3
В.
.5
-3
2
1
0
1
2
3
4
C
4
13
2
1
0
1
2
3
D.
1
1
3
A. Graph A
B. Graph B
C. Graph
D. Graph D

Answers: 3


Other questions on the subject: Mathematics
Mathematics, 20.06.2019 18:04, zacksoccer8279
Antonio made a scale model of a building. the model's scale is 1 inch to 235 feet and its height is 3.5 inches. what is the exact height of the actual building? enter your answer in the box.
Answers: 1
Mathematics, 21.06.2019 12:30, lanaiheart7
The empire state building in new york city is 1454 feet tall a model of a building is 24 inches tall what is the ratio of the height of the model to the height of the actual empire state building
Answers: 1
Mathematics, 21.06.2019 13:20, angelalovelis
Clara solved the equation 7/3x = −2/3 as shown → 7/3x( 3/7 ) = −2/3 ( 3/7 ) x = −14 what is clara’s error?
Answers: 1
Mathematics, 21.06.2019 23:30, Thefiles
In stepmber, daniel and justin opened a business. during their first three months of business, their average monthly profit was $51. if during their first month, they lost $29, and during their second month, they gained $115, what was their profit or loss for their third plzzz i will give you 299 points
Answers: 1
You know the right answer?
Questions in other subjects:
Mathematics, 22.07.2019 18:30

Computers and Technology, 22.07.2019 18:30


