
Mathematics, 10.07.2021 22:40 maxi12312345
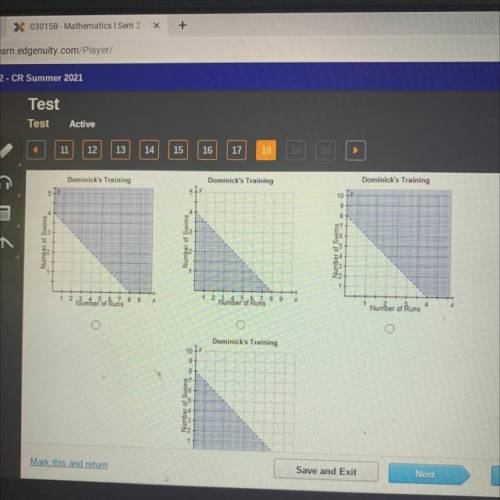
Dominick is training for a race. He spends 0.75 hours running each time he runs and 1.5 hours swimming each time
he swims. This week, he spent more than 6 hours training for the race. Which graph represents his possible training
times this week?

Answers: 2


Other questions on the subject: Mathematics
Mathematics, 21.06.2019 19:30, mariaaaaa69
Complete the solution of the equation. find the value of y when x equals to 28 x+3y=28
Answers: 2
You know the right answer?
Dominick is training for a race. He spends 0.75 hours running each time he runs and 1.5 hours swimmi...
Questions in other subjects:


Mathematics, 20.09.2019 17:20
Mathematics, 20.09.2019 17:20
Mathematics, 20.09.2019 17:20


