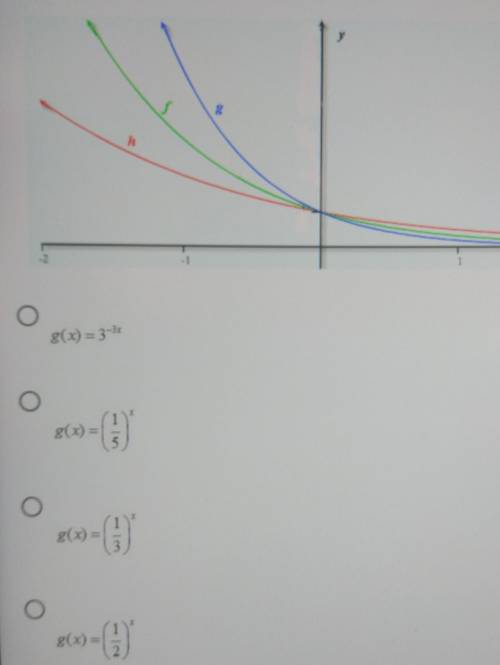
For the Graph Below, Which of the following is a possible function for g?
...

Mathematics, 10.07.2021 19:20 anthonybowie99
For the Graph Below, Which of the following is a possible function for g?

Answers: 2


Other questions on the subject: Mathematics
Mathematics, 21.06.2019 23:00, tfyvcu5344
The weight of a radioactive isotope was 96 grams at the start of an experiment. after one hour, the weight of the isotope was half of its initial weight. after two hours, the weight of the isotope was half of its weight the previous hour. if this pattern continues, which of the following graphs represents the weight of the radioactive isotope over time? a. graph w b. graph x c. graph y d. graph z
Answers: 2
You know the right answer?
Questions in other subjects:

Biology, 10.08.2019 02:10
Biology, 10.08.2019 02:10
Biology, 10.08.2019 02:10
Biology, 10.08.2019 02:10
Biology, 10.08.2019 02:10


