
Mathematics, 10.07.2021 07:30 kcain1020
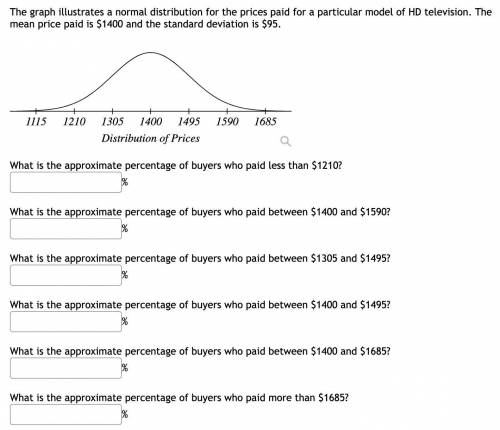
Please see attached for the question. The graph illustrates a normal distribution for the prices paid for a particular model of HD television. The mean price paid is $1400 and the standard deviation is $95.

Answers: 3


Other questions on the subject: Mathematics
Mathematics, 21.06.2019 15:00, katie18147
Answer this question only if you know the answer! 30 points and
Answers: 1
Mathematics, 21.06.2019 23:00, naomiedgrey
Look at the chart showing the results of a baseball player at bat. which is the probability of getting a hit?
Answers: 1
You know the right answer?
Please see attached for the question. The graph illustrates a normal distribution for the prices pai...
Questions in other subjects:

Spanish, 12.07.2019 07:30

Social Studies, 12.07.2019 07:30

Mathematics, 12.07.2019 07:30

History, 12.07.2019 07:30
History, 12.07.2019 07:30


