
Mathematics, 10.07.2021 01:00 Jolenesopalski
Distributions and Comparing Data Project
Round all answers to the nearest tenth. Present your work in a neat, legible way. Show all work.
Given the data set (16 values):
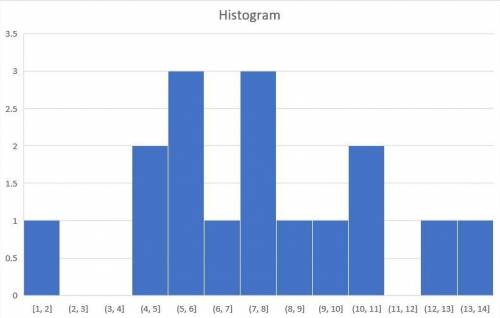
8, 6, 10, 5, 7, 1, 6, 11, 5, 13, 14, 8, 11, 9, 8, 6
1. Create a histogram and a box plot to represent this data set. What is the shape of the data
representation? Explain your reasoning.
2. Which measure of center and spread would you use to represent this data? Explain your reasoning.
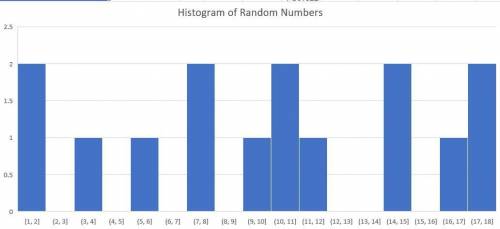
3. Use a random number generator to generate a set of 15 numbers between 1 and 20. Create a
histogram and box plot to represent your data set. Calculate measures of center and spread. Which
measure of center and spread would you use to represent your data?
For questions 6-9 refer to the box plots (Assume their positions are on same number line). Write your
Class A
Class B
Class C
Class D
o
4. Which class(es) appear to have the most consistent scores? Explain your reasoning,

Answers: 3
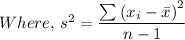
 = 453.333
 /(15 - 1) = 32.38
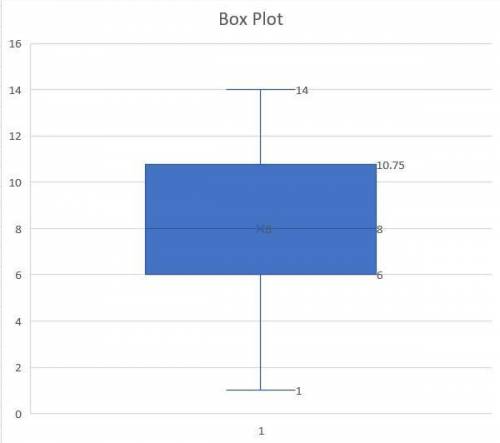


Other questions on the subject: Mathematics
Mathematics, 21.06.2019 18:50, rosas8
Astudent draws two parabolas on graph paper. both parabolas cross the x-axis at (-4, 0) and (6,0). the y-intercept of thefirst parabola is (0, –12). the y-intercept of the second parabola is (0-24). what is the positive difference between the avalues for the two functions that describe the parabolas? write your answer as a decimal rounded to the nearest tenth.
Answers: 2
Mathematics, 22.06.2019 00:20, yoyo80431
Sherrie is baking a pie for her family. she leaves the room and comes back to 35% of the pie having been eaten before she can put the topping on. how much 1 square inch strips of dough will she need for the top, now that a portion is missing? round your answer to the nearest while nimber.
Answers: 1
You know the right answer?
Distributions and Comparing Data Project
Round all answers to the nearest tenth. Present your work...
Questions in other subjects:

English, 08.01.2021 22:10
Mathematics, 08.01.2021 22:10
Mathematics, 08.01.2021 22:10

History, 08.01.2021 22:10
Mathematics, 08.01.2021 22:10


