
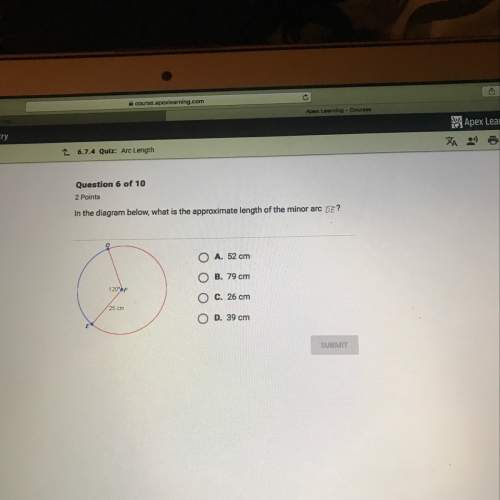
Mathematics, 06.07.2021 20:00 kb0767729
A box plot is shown. The left-most point on the plot is 20 and the right-most point is 95. The box is labeled 40 on the left edge and 60 on the right edge. A vertical line is drawn inside the rectangle at the point 50.
Part A: List two pieces of information that are provided by the graph and one piece of information that is not provided by the graph. (4 points)
Part B: Calculate the interquartile range of the data, and explain in a sentence or two what it represents. (4 points)
Part C: Explain what affect, if any, there will be if an outlier is present. (2 points)
Please someone answer all of the parts ASAP

Answers: 3


Other questions on the subject: Mathematics
Mathematics, 21.06.2019 13:00, Alexmills6093
Use the diagonals to determine whether a parallelogram with vertices u(2,−2), v(9,−2), w(9,−6), and x(2,−6) is a rectangle, rhombus, or square. give all the names that apply.
Answers: 3
Mathematics, 21.06.2019 17:00, casting479
Ajar of gumballs contains 4 reds, 2 greens, and 6 blues. what is the probability of getting two blues in a row without replacement?
Answers: 1
Mathematics, 21.06.2019 17:00, tifftiff22
The volume of a cube is 8 in to the 3rd power. how long is each side?
Answers: 1
You know the right answer?
A box plot is shown. The left-most point on the plot is 20 and the right-most point is 95. The box i...
Questions in other subjects:

Social Studies, 09.07.2019 11:00
Mathematics, 09.07.2019 11:00

History, 09.07.2019 11:00

Mathematics, 09.07.2019 11:00
English, 09.07.2019 11:00
Mathematics, 09.07.2019 11:00


