
Mathematics, 30.06.2021 21:00 rehel1546
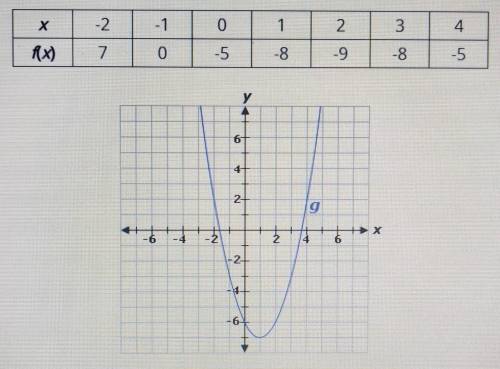
The table represents function f, and the graph represents function g.
x: -2, -1, 0, 1, 2, 3, 4
f(x): 7, 0, -5, -8, -9, -8, -5
The line of symmetry for function f is (y=9, x= -2, x=2, y= -9) and the line of symmetry for function g is (x=1,y=7,x= -1,y= -7). The y-intercept of function f is (equal to, less than, greater than) the y-intercept of function g. Over the interval [2, 4], the average rate of change of function f is (greater than, equal to, less than) the average rate of change of function g.

Answers: 2


Other questions on the subject: Mathematics
Mathematics, 21.06.2019 12:30, lanakay2006
Timed***how else can the sequence for row 1 be written? notice: square a: 1 penny = 20 square b: 2 pennies = 21 square c: 4 pennies = 22 the sequence formed is geometric, with a1 = , and common ratio r = .
Answers: 1
Mathematics, 21.06.2019 18:30, Katlyndavis01
What is the answer to this question? i'm a bit stumped. also how do i do it? 5(x - 4) = 2(x + 5)
Answers: 1
You know the right answer?
The table represents function f, and the graph represents function g.
x: -2, -1, 0, 1, 2, 3, 4
Questions in other subjects:


Mathematics, 31.08.2019 02:10


English, 31.08.2019 02:10
Mathematics, 31.08.2019 02:10
Mathematics, 31.08.2019 02:10


