
Mathematics, 28.06.2021 01:50 lelen2021
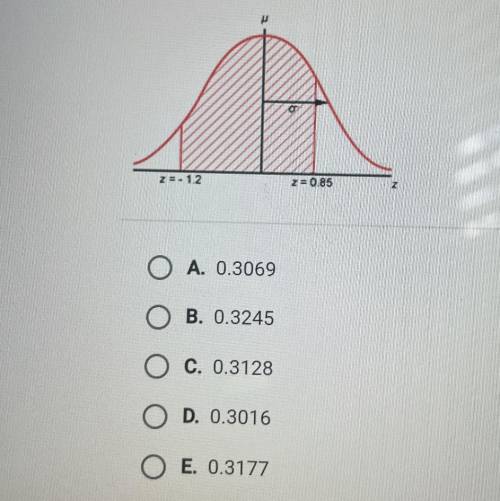
The standard normal curve shown below models the population distribution of a random variable. What proportion of the values in the population does not lie between the two z-scores indicated on the diagram?
A. 0.3069
B. 0.3245
C. 0.3128
D. 0.3016
E. 0.3177

Answers: 3


Other questions on the subject: Mathematics
Mathematics, 21.06.2019 17:00, cordovatierra16
Which graph corresponds to the function f(x) = x2 + 4x – 1?
Answers: 1
Mathematics, 21.06.2019 19:00, kamilahmcneil3969
You are at a restaurant and owe $56.20 for your meal. you want to leave an 18% tip. approximately how much is your tip?
Answers: 1
Mathematics, 21.06.2019 22:30, yettionajetti
In order to be invited to tutoring or extension activities a students performance 20 point higher or lower than average for the
Answers: 1
Mathematics, 22.06.2019 00:00, mattiemattoos
One of the complementary angles is 4 degrees mor than the other. find the angles (recall that complementary angles are angles whose sum is 90 degrees.) which of the following can not be used to solve the problem if x represents one of the angles? a. 2x-4=90 b. 2x+4=90 c. x+4=90
Answers: 1
You know the right answer?
The standard normal curve shown below models the population distribution of a random variable. What...
Questions in other subjects:


History, 13.01.2021 17:10


