(08.07 MC)
A polynomial function is shown below:
f(x) = x3 − 3x2 − 4x + 12
...

Mathematics, 27.06.2021 05:30 lopezma152
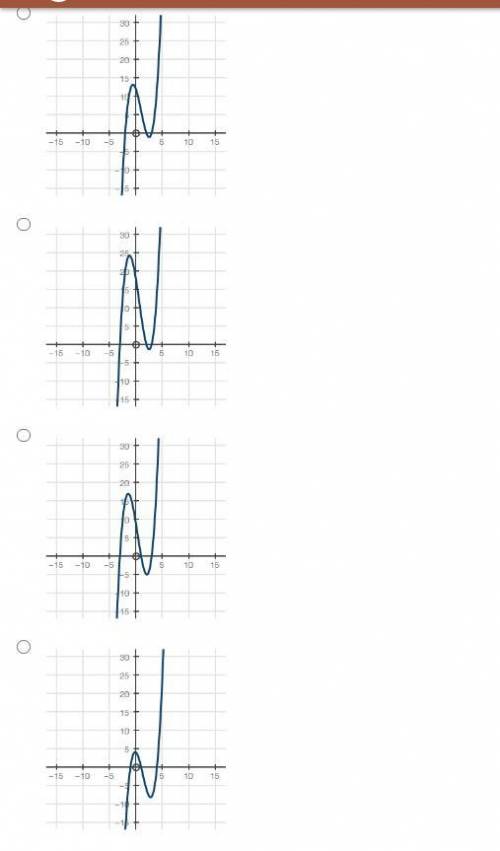
(08.07 MC)
A polynomial function is shown below:
f(x) = x3 − 3x2 − 4x + 12
Which graph best represents the function? (5 points)

Answers: 3


Other questions on the subject: Mathematics
Mathematics, 21.06.2019 22:00, kharmaculpepper
Question 13 (1 point) jerome is starting a new job. his contract states he will earn $42,000 the first year, and will get a 4% raise per year. which function s(x) represents jerome's salary after a certain number of years, x?
Answers: 1
Mathematics, 22.06.2019 01:30, zitterkoph
The box plots show the distributions of the numbers of words per line in an essay printed in two different fonts.which measure of center would be best to compare the data sets? the median is the best measure because both distributions are left-skewed.the mean is the best measure because both distributions are left-skewed.the median is the best measure because both distributions are symmetric.the mean is the best measure because both distributions are symmetric
Answers: 1
You know the right answer?
Questions in other subjects:


Mathematics, 24.09.2019 05:30


World Languages, 24.09.2019 05:30
History, 24.09.2019 05:30

Mathematics, 24.09.2019 05:30


