
Mathematics, 25.06.2021 20:50 bananaslugs
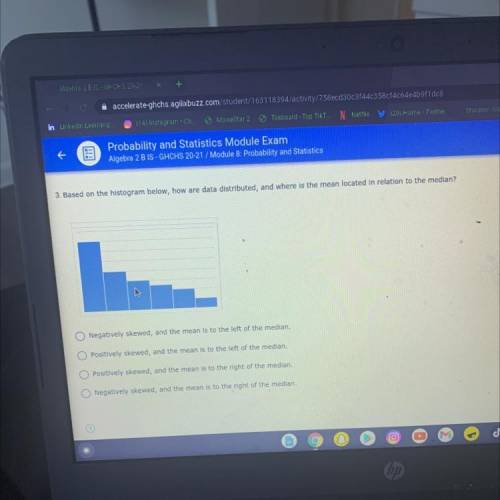
3. Based on the histogram below, how are data distributed, and where is the mean located in relation to the median?
w
O Negatively skewed, and the mean is to the left of the median.
Positively skewed, and the mean is to the left of the median.
O Positively skewed, and the mean is to the right of the median.
O Negatively skewed, and the mean is to the right of the median

Answers: 3


Other questions on the subject: Mathematics
Mathematics, 21.06.2019 17:20, kyle696969
Consider the expression below. 9 + 4(x + 2) – 3.1 select the term that best describes "3" in the given expression. o a. coefficient variable exponent constant
Answers: 2
Mathematics, 21.06.2019 18:50, trevionc0322
Which of the following values cannot be probabilities? 0.08, 5 divided by 3, startroot 2 endroot, negative 0.59, 1, 0, 1.44, 3 divided by 5 select all the values that cannot be probabilities. a. five thirds b. 1.44 c. 1 d. startroot 2 endroot e. three fifths f. 0.08 g. 0 h. negative 0.59
Answers: 2
Mathematics, 21.06.2019 23:00, lejeanjamespete1
Graph the system of equations. {6x−4y=−244x−8y=−32 use the line tool to graph the lines.
Answers: 1
You know the right answer?
3. Based on the histogram below, how are data distributed, and where is the mean located in relation...
Questions in other subjects:

Mathematics, 13.04.2021 20:50

Mathematics, 13.04.2021 20:50


Social Studies, 13.04.2021 20:50
English, 13.04.2021 20:50
English, 13.04.2021 20:50


