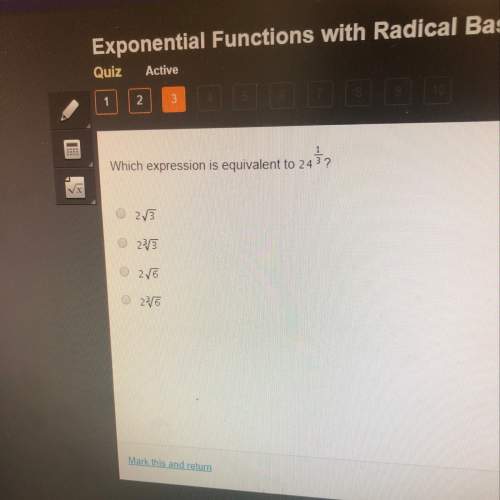
Mathematics, 25.06.2021 01:40 angel20202
On April 1, the price of gas at Bob’s Corner Station was $3.70 per gallon. On May 1, the price was $4.20 per gallon. On June 1, it was back down to $3.70 per gallon. Between April 1 and May 1, Bob’s price increased by , or . Between May 1 and June 1, Bob’s price decreased by , or . Suppose that at a gas station across the street, prices are always 20% higher than Bob’s. In absolute dollar terms, the difference between Bob’s prices and the prices across the street is when gas costs $4.20 than when gas costs $3.70. Some economists blame high commodity prices (including the price of gas) on interest rates being too low. Suppose the Fed raises the target for the federal funds rate from 2% to 2.5%. This change of percentage points means that the Fed raised its target by approximately .

Answers: 1


Other questions on the subject: Mathematics

Mathematics, 21.06.2019 20:30, catcatscats122
Write two point-slope equations for the line passing through the points (6, 5) and (3, 1)
Answers: 1

Mathematics, 22.06.2019 00:30, carriboneman
"which statement is necessarily true if bd is an altitude to the hypotenuse of right ? abc? a.) ? adb? ? bdc b.) ? adb~? bdc c.) abbc=acbd d.) ? bac? ? bdc"
Answers: 3

Mathematics, 22.06.2019 02:00, mathhelppls14
1. the manager of collins import autos believes the number of cars sold in a day (q) depends on two factors: (1) the number of hours the dealership is open (h) and (2) the number of salespersons working that day (s). after collecting data for two months (53 days), the manager estimates the following log-linear model: q 4 equation 1 a. explain, how to transform the log-linear model into linear form that can be estimated using multiple regression analysis. the computer output for the multiple regression analysis is shown below: q4 table b. how do you interpret coefficients b and c? if the dealership increases the number of salespersons by 20%, what will be the percentage increase in daily sales? c. test the overall model for statistical significance at the 5% significance level. d. what percent of the total variation in daily auto sales is explained by this equation? what could you suggest to increase this percentage? e. test the intercept for statistical significance at the 5% level of significance. if h and s both equal 0, are sales expected to be 0? explain why or why not? f. test the estimated coefficient b for statistical significance. if the dealership decreases its hours of operation by 10%, what is the expected impact on daily sales?
Answers: 2

Mathematics, 22.06.2019 03:10, xarianna2007
Marking brainliest for original answer.. are these two triangles similar? how can you tell?
Answers: 2
You know the right answer?
On April 1, the price of gas at Bob’s Corner Station was $3.70 per gallon. On May 1, the price was $...
Questions in other subjects:

Mathematics, 18.03.2021 16:50

Mathematics, 18.03.2021 16:50

Mathematics, 18.03.2021 16:50

Mathematics, 18.03.2021 16:50

Mathematics, 18.03.2021 16:50

Mathematics, 18.03.2021 16:50


Mathematics, 18.03.2021 16:50


