
Mathematics, 24.06.2021 22:30 jasontbyrer
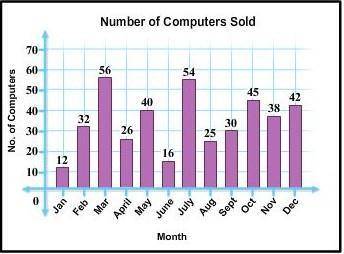
This Bar Chart shows the number of computers sold each month at a local computer store during one year.
Which measure(s) of central tendency can be used to determine the average number of computers sold each month?
A. the median
B. the mean
C. the mean and the median
D. the mode

Answers: 2


Other questions on the subject: Mathematics
Mathematics, 21.06.2019 22:10, laurenbreellamerritt
On a piece of paper, graph y< x-1. then determine which answer choicematches the graph you drew.13. z3. 2(3.290-1)
Answers: 2
Mathematics, 21.06.2019 22:10, carsondelane13
Monitors manufactured by tsi electronics have life spans that have a normal distribution with a standard deviation of 1800 hours and a mean life span of 20,000 hours. if a monitor is selected at random, find the probability that the life span of the monitor will be more than 17,659 hours. round your answer to four decimal places.
Answers: 2
You know the right answer?
This Bar Chart shows the number of computers sold each month at a local computer store during one ye...
Questions in other subjects:

Mathematics, 06.02.2021 01:00


History, 06.02.2021 01:00
History, 06.02.2021 01:00

English, 06.02.2021 01:00


