Statistics I Spring 2021
Homework: HW #7 Sections 7.1 and 7.2
Score: 0 of 1 pt
2 of 30...

Mathematics, 23.06.2021 21:10 briseisr20
Statistics I Spring 2021
Homework: HW #7 Sections 7.1 and 7.2
Score: 0 of 1 pt
2 of 30 (1 complete)
7.1.5
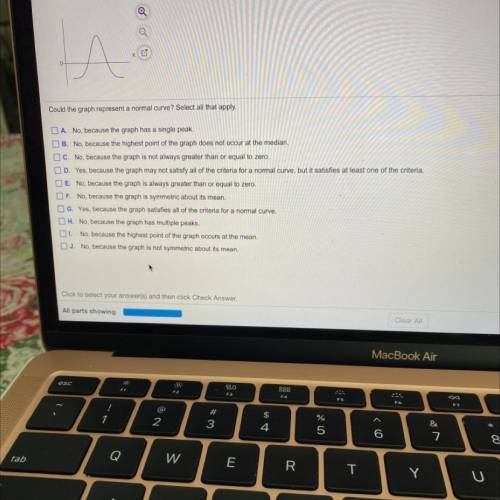
Determine whether the following graph can represent a normal curve.
A
x
Could the graph represent a normal curve? Select all that apply.
DA. No, because the graph has a single peak.
B. No, because the highest point of the graph does not occur at the median
C. No, because the graph is not always greater than or equal to zero.
D. Yes, because the graph may not satisfy all of the criteria for

Answers: 3


Other questions on the subject: Mathematics
Mathematics, 21.06.2019 17:30, liquidmana42
When the solutions to each of the two equations below are graphed in the xy-coordinate plane, the graphs of the solutions intersect at two places. write the y-cordninates of the points of intersection in the boxes below in order from smallest to largest. y=2x y=x^2-3
Answers: 1
Mathematics, 22.06.2019 00:00, madisonvinson80
Julia bought 7 hats a week later half of all her hats were destroyed in a fire. there are now only 12 hats left with how many did she start
Answers: 1
Mathematics, 22.06.2019 00:30, steviedude316
Round each of the decimals to the nearest hundredth a. 0.596 b. 4.245 c. 53.6843 d. 17.999
Answers: 2
You know the right answer?
Questions in other subjects:
Mathematics, 18.11.2020 01:00

English, 18.11.2020 01:00

Mathematics, 18.11.2020 01:00
History, 18.11.2020 01:00
English, 18.11.2020 01:00


