
Mathematics, 23.06.2021 01:00 Cassandra100
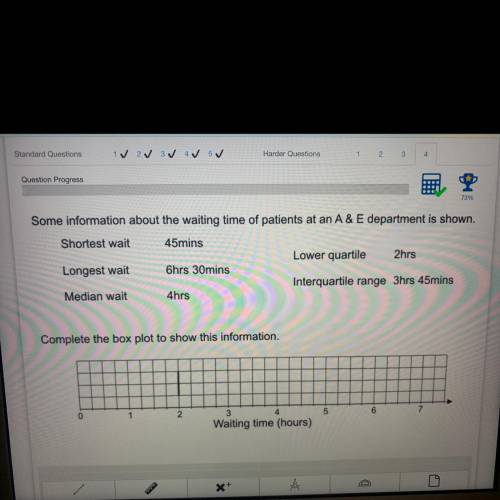
Some information about the waiting time of patients at an A & E department is shown.
Shortest wait
45mins
Lower quartile
2hrs
Longest wait
6hrs 30mins
Interquartile range 3hrs 45mins
Median wait
4hrs
Complete the box plot to show this information.

Answers: 3


Other questions on the subject: Mathematics
Mathematics, 21.06.2019 16:30, shyann78
In two or more complete sentences, formulate how to use technology to calculate the appropriate regression model for the given data. you are not required to find the model, just choose the appropriate regression and explain how to use the technology. (-5,,2.,0.8), (0,-0.5), (2,-1.3), (3,-0.8), (5,2)
Answers: 2
Mathematics, 21.06.2019 18:30, Binger4115
If you have the following equation, 2/3x+5/6-x=2-3/4x what would you multiply each term by to get rid of all the fractions
Answers: 3
You know the right answer?
Some information about the waiting time of patients at an A & E department is shown.
Shortest w...
Questions in other subjects:

History, 26.01.2021 01:00

Chemistry, 26.01.2021 01:00


Physics, 26.01.2021 01:00

Physics, 26.01.2021 01:00


