
Mathematics, 21.06.2021 20:10 queenb1416
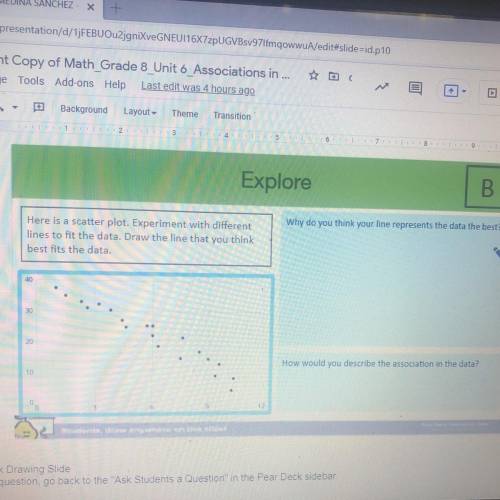
Why do you think your line represents the data the best?
Here is a scatter plot. Experiment with different
lines to fit the data. Draw the line that you think
best fits the data.
40
30
20
How would you describe the association in the data?
10
0
12

Answers: 3


Other questions on the subject: Mathematics
Mathematics, 20.06.2019 18:04, wardlawshaliyah
Acollege is planning to construct a rectangular parking lot on land bordered on one side by a highway. the plan is to use 680 feet of fencing to fence off the other three sides. what dimensions should the lot have if the enclosed area is to be a maximum?
Answers: 3
Mathematics, 21.06.2019 14:50, hiihihihij
Do 12/14 and 8/10 have the same value? explain your answer.
Answers: 1
Mathematics, 22.06.2019 00:00, jadfavors4321
Parallelogram efgh is a rectangle. he = 6, and fe = 8. find ge: and find fj:
Answers: 1
You know the right answer?
Why do you think your line represents the data the best?
Here is a scatter plot. Experiment with di...
Questions in other subjects:

Mathematics, 11.10.2020 15:01

Mathematics, 11.10.2020 15:01
Mathematics, 11.10.2020 15:01
Mathematics, 11.10.2020 15:01

History, 11.10.2020 15:01


