See image for question.
Show workings. Sorry for the wobbly writing .
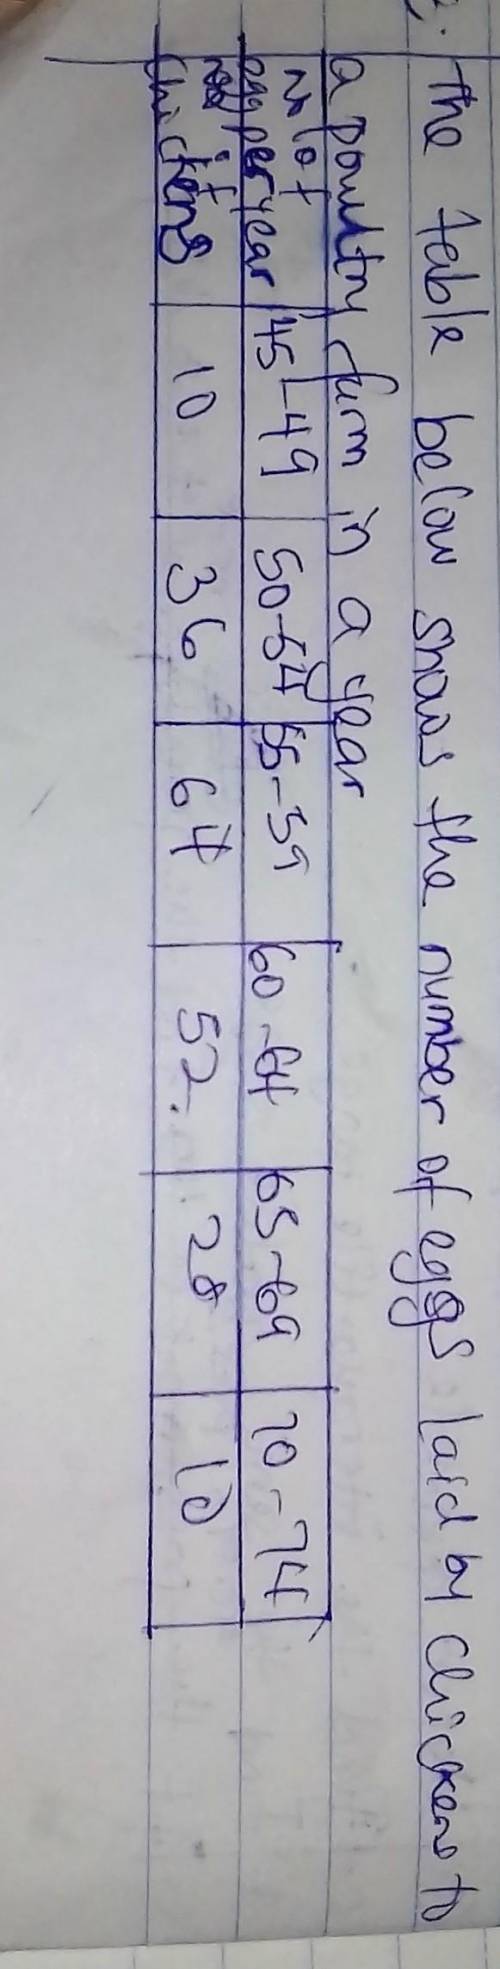
Question : a. draw a cumulative frequency curve of the distribution b. use the graph to find interquartile range. c. a woman buys a chicken from the farm what is the probability that the chicken lays at least 60 eggs in a year.
In 2000 there were 100 rabbits in central park the population increased by 16% each year ? write a function to illustrate the situation. how many rabbits were in central park in 2005 . predict how many rabbits there will be at the end of this year we are in 2018?