
Mathematics, 18.06.2021 03:20 Carlyalexis641
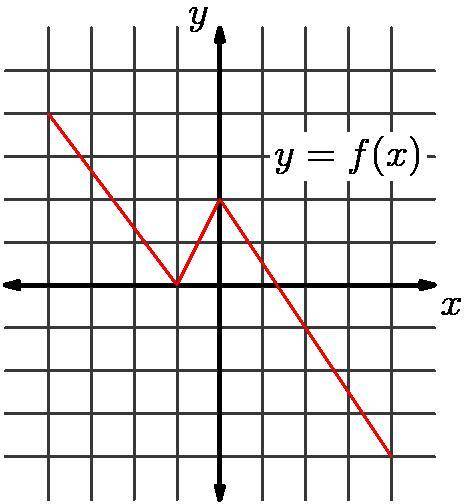
The graph of $y = f(x)$ is shown below.
For each point $(a, b)$ that is on the graph of $y = f(x),$ the point $\left( 3a - 1, \frac{b}{2} \right)$ is plotted, forming the graph of another function $y = g(x).$ As an example, the point $(0,2)$ lies on the graph of $y = f(x),$ so the point $(3 \cdot 0 - 1, 2/2) = (-1,1)$ lies on the graph of $y = g(x).$
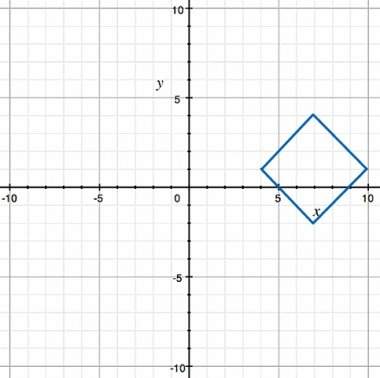
(a) Plot the graph of $y = g(x).$ Include the diagram as part of your solution.
(b) Express $g(x)$ in terms of $f(x).$
(c) Describe the transformations that can be applied to the graph of $y = f(x)$ to obtain the graph of $y = g(x).$ For example, one transformation could be to stretch the graph vertically by a factor of $4.$

Answers: 3


Other questions on the subject: Mathematics
Mathematics, 21.06.2019 13:30, carlalopezelox9533
Patel’s class voted on their favorite color. patel plans to make a circle graph to display the results. which statements are true about the circle graph patel can create? check all that apply.
Answers: 2
Mathematics, 21.06.2019 14:30, jorgefrom584
Cass decided to sell game programs for the hockey game. the printing cost was over 20 cents per program with a selling price of 50 cents each. cass sold all but 50 of the programs, and made a profit of $65. how many programs were printed? letting p represent the number of programs printed, set up an equation that describes this situation. then solve your equation for p.
Answers: 1
Mathematics, 21.06.2019 14:30, mia2286
Chandler was a caretaker at the state zoo. he noticed that the number of animals adopted by the zoo increased at a constant rate every year since 2010. which of the following graphs shows the slowest rate at which the animals in the zoo were adopted?
Answers: 2
You know the right answer?
The graph of $y = f(x)$ is shown below.
For each point $(a, b)$ that is on the graph of $y = f(x),$...
Questions in other subjects:


Social Studies, 08.04.2020 17:22

Mathematics, 08.04.2020 17:22
English, 08.04.2020 17:23


