
Mathematics, 16.06.2021 22:40 punkinrichard1oxon2i
Percentage of population supplied by water supply industry
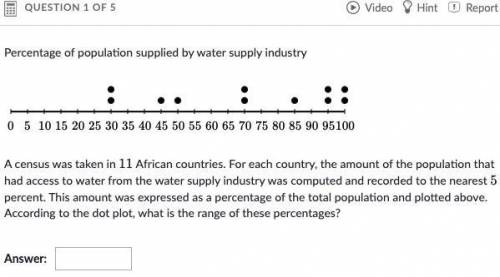
This image is a dot plot. The tick marks begin at 0% and go to 100% in increments of 5 percentage points. There are two dots at 30%, one dot at 45%, one dot at 50%, two dots at 70%, one dot at 85%, two dots at 95%, and two dots at 100%.
This image is a dot plot. The tick marks begin at 0% and go to 100% in increments of 5 percentage points. There are two dots at 30%, one dot at 45%, one dot at 50%, two dots at 70%, one dot at 85%, two dots at 95%, and two dots at 100%.
A census was taken in 11 African countries. For each country, the amount of the population that had access to water from the water supply industry was computed and recorded to the nearest 5 percent. This amount was expressed as a percentage of the total population and plotted above. According to the dot plot, what is the range of these percentages?

Answers: 3


Other questions on the subject: Mathematics
Mathematics, 21.06.2019 14:10, shawnnoteman1234
What is the perimeter, p, of a rectangle that has a length of x + 8 and a width of y − 1? p = 2x + 2y + 18 p = 2x + 2y + 14 p = x + y − 9 p = x + y + 7
Answers: 3
Mathematics, 21.06.2019 14:30, Harini5721
The expression 6x2 gives the surface area of a cube, and the expression x3 gives the volume of a cube, where x is the length of one side of the cube. find the surface area and the volume of a cube with a side length of 6m
Answers: 3
Mathematics, 21.06.2019 17:20, psychocatgirl1
Which system of linear inequalities is represented by the graph? + l tv x-3y > 6 and y > 2x o x + 3y > 6 and y o x-3y > 6 and y> 2x o x + 3y > 6 and y > 2x + 4 la +
Answers: 1
You know the right answer?
Percentage of population supplied by water supply industry
This image is a dot plot. The tick marks...
Questions in other subjects:

Mathematics, 23.06.2019 00:30

Mathematics, 23.06.2019 00:30

Chemistry, 23.06.2019 00:30
Mathematics, 23.06.2019 00:30


