
Mathematics, 15.06.2021 21:00 bryanmcmillianjr
Image attached
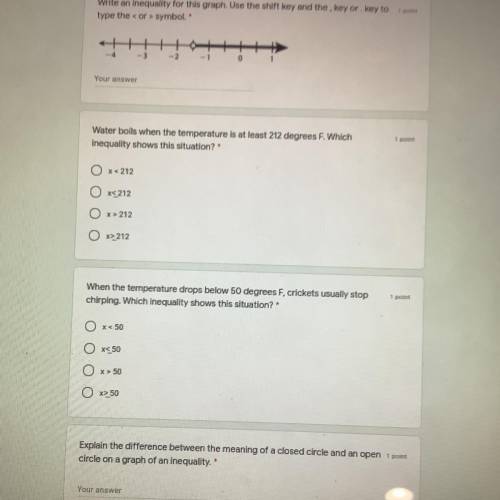
A) 1 point Write an inequality for this graph . Use the shift key and the key or key to type the < or > symbol . *
B) Water boils when the temperature is at least 212 degrees F. Which inequality shows this situation ?
C) When the temperature drops below 50 degrees F , crickets usually stop chirping . Which inequality shows this situation ?
D) Explain the difference between the meaning of a closed
circle and an open circle on a graph of an inequality .

Answers: 3


Other questions on the subject: Mathematics
Mathematics, 21.06.2019 17:00, JOEREACH
Use the expression below.–4b + 8c + 12 – 8b – 2c + 6part asimplify the expression. enter your answers in the boxes. b + c + part bfactor the simplified expression using the gcf. a. 2(–2b + c + 3) b. 3(–2b + c + 3) c. 4(–2b + c + 3) d. 6(–2b + c + 3)part cwhat is the value of the expression when b = 2 and c = –3? enter your answer in the box.
Answers: 1
Mathematics, 21.06.2019 20:20, Tnaaasty5901
Convert the mixed numbers into improper fractions. convert the improper fraction to mixed numbers.
Answers: 1
Mathematics, 21.06.2019 23:00, kj44
Each of the following data sets has a mean of x = 10. (i) 8 9 10 11 12 (ii) 7 9 10 11 13 (iii) 7 8 10 12 13 (a) without doing any computations, order the data sets according to increasing value of standard deviations. (i), (iii), (ii) (ii), (i), (iii) (iii), (i), (ii) (iii), (ii), (i) (i), (ii), (iii) (ii), (iii), (i) (b) why do you expect the difference in standard deviations between data sets (i) and (ii) to be greater than the difference in standard deviations between data sets (ii) and (iii)? hint: consider how much the data in the respective sets differ from the mean. the data change between data sets (i) and (ii) increased the squared difference îł(x - x)2 by more than data sets (ii) and (iii). the data change between data sets (ii) and (iii) increased the squared difference îł(x - x)2 by more than data sets (i) and (ii). the data change between data sets (i) and (ii) decreased the squared difference îł(x - x)2 by more than data sets (ii) and (iii). none of the above
Answers: 2
You know the right answer?
Image attached
A) 1 point Write an inequality for this graph . Use the shift key and the key or key...
Questions in other subjects:

Social Studies, 14.06.2020 01:57
Mathematics, 14.06.2020 01:57

History, 14.06.2020 01:57
Mathematics, 14.06.2020 01:57
Mathematics, 14.06.2020 01:57
Mathematics, 14.06.2020 01:57
Mathematics, 14.06.2020 01:57


