
Mathematics, 14.06.2021 16:20 juliapreciiado
US
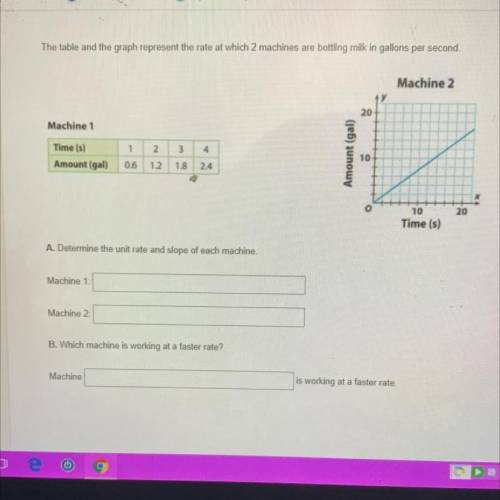
The table and the graph represent the rate at which 2 machines are bottling milk in gallons per second.
Machine 2
20
Machine 1
Time (s)
1
2
3
4
Amount (gal)
10
Amount (gal)
0.6
1.2.
1.8
2.4
o
20
10
Time (s)
A. Determine the unit rate and slope of each machine.
Machine 1:
Machine 2
B. Which machine is working at a faster rate?
Machine
is working at a faster rate.

Answers: 3


Other questions on the subject: Mathematics
Mathematics, 21.06.2019 14:40, kingteron6166
Which system of linear inequalities is represented by the graph? !
Answers: 1
Mathematics, 21.06.2019 16:30, jimyyyy
Which composition of similarity transformations maps polygon abcd to polygon a'b'c'd'? a dilation with a scale factor less than 1 and then a reflection a dilation with a scale factor less than 1 and then a translation a dilation with a scale factor greater than 1 and then a reflection a dilation with a scale factor greater than 1 and then a translation
Answers: 3
Mathematics, 21.06.2019 19:30, nmg9
The revenue each season from tickets at the theme park is represented by t(c)=5x. the cost to pay the employees each season is represented by r(x)=(1.5)^x. examine the graph of the combined function for total profit and estimate the profit after four seasons
Answers: 3
Mathematics, 21.06.2019 20:00, offensiveneedle
1: 4 if the wew 35 surfboards at the beach how many were short boards?
Answers: 1
You know the right answer?
US
The table and the graph represent the rate at which 2 machines are bottling milk in gallons per...
Questions in other subjects:


Mathematics, 19.03.2020 18:11


