
Mathematics, 14.06.2021 15:40 cubist7472
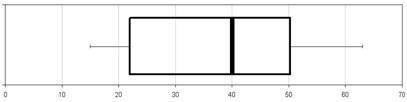
Parth created a Box-and-Whisker Plot to show the average weight of the fish he caught over the weekend. What information from the 1st Quartile does the graph give you?
A. Three fourths of the fish he caught were larger than 22 pounds.
B. The average weight of the fish he caught was 40 pounds.
C. Three fourths of the fish he caught were less than 22 pounds.
D. The largest fish he caught was 63 pounds.

Answers: 3


Other questions on the subject: Mathematics
Mathematics, 20.06.2019 18:02, Shihhschool20
Aline of best fit is drawn for the set of points shown on the graph. which point is an approximate extrapolation for x = 30 from the line of best fit?
Answers: 1
Mathematics, 21.06.2019 12:50, marelinatalia2000
Assume cd | ab are parallel. find m2. a) x= 50° (b) x = 70° c) x = 30° d) x = 60
Answers: 1
Mathematics, 21.06.2019 16:10, cthompson1107
Which expression gives the area of the triangle shown below
Answers: 1
You know the right answer?
Parth created a Box-and-Whisker Plot to show the average weight of the fish he caught over the weeke...
Questions in other subjects:


