
Mathematics, 14.06.2021 08:40 tiarafaimealelei
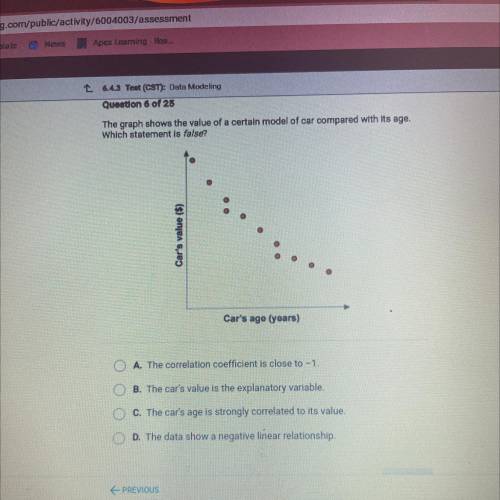
The graph shows the value of a certain model of car compared with its age.
Which statement is false?
Car's value ($)
Car's ago (years)
A. The correlation coefficient is close to -1,
B. The car's value is the explanatory variable.
O O Od
C. The car's age is strongly correlated to its value.
D. The data show a negative linear relationship.

Answers: 3


Other questions on the subject: Mathematics
Mathematics, 21.06.2019 15:30, shortyyashaun
Me! 50 points! why does when we come home, our door is unlocked and there is grease on the door knob, me solve this , and i don't know what category this goes under
Answers: 2
Mathematics, 21.06.2019 15:40, helper4282
The number of lattes sold daily for two coffee shops is shown in the table: lattes 12 52 57 33 51 15 46 45 based on the data, what is the difference between the median of the data, including the possible outlier(s) and excluding the possible outlier(s)? 48.5 23 8.4 3
Answers: 3
Mathematics, 21.06.2019 16:00, kell22wolf
Part one: measurements 1. measure your own height and arm span (from finger-tip to finger-tip) in inches. you will likely need some from a parent, guardian, or sibling to get accurate measurements. record your measurements on the "data record" document. use the "data record" to you complete part two of this project. name relationship to student x height in inches y arm span in inches archie dad 72 72 ginelle mom 65 66 sarah sister 64 65 meleah sister 66 3/4 67 rachel sister 53 1/2 53 emily auntie 66 1/2 66 hannah myself 66 1/2 69 part two: representation of data with plots 1. using graphing software of your choice, create a scatter plot of your data. predict the line of best fit, and sketch it on your graph. part three: the line of best fit include your scatter plot and the answers to the following questions in your word processing document 1. 1. which variable did you plot on the x-axis, and which variable did you plot on the y-axis? explain why you assigned the variables in that way. 2. write the equation of the line of best fit using the slope-intercept formula $y = mx + b$. show all your work, including the points used to determine the slope and how the equation was determined. 3. what does the slope of the line represent within the context of your graph? what does the y-intercept represent? 5. use the line of best fit to you to describe the data correlation.
Answers: 2
Mathematics, 21.06.2019 21:30, kimlyn58p0wyn0
The price of a dozen eggs was $1.63. suppose the price increases m dollars per dozen and then the price decreases $0.12 per dozen. which expression represents the current price of eggs after the two price changes?
Answers: 1
You know the right answer?
The graph shows the value of a certain model of car compared with its age.
Which statement is false...
Questions in other subjects:
Mathematics, 06.09.2021 01:50
Mathematics, 06.09.2021 01:50

Mathematics, 06.09.2021 01:50
Mathematics, 06.09.2021 01:50


