
Mathematics, 12.06.2021 18:50 ameliaxbowen7
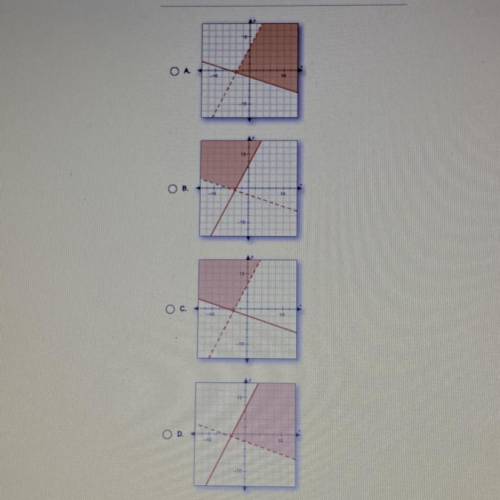
Which graph represents the solution set to the following system of linear inequalities?
y ≤ 2x + 7
y > -1/3 x - 2

Answers: 3


Other questions on the subject: Mathematics
Mathematics, 21.06.2019 12:40, sissy11145
Points d and e are midpoints of the sides of triangle abc. the perimeter of the triangle is 48 units. what is the value of t? ο ο ο ο 7t +
Answers: 1
Mathematics, 21.06.2019 16:20, bestballer7095
Aclass consists of 55% boys and 45% girls. it is observed that 25% of the class are boys and scored an a on the test, and 35% of the class are girls and scored an a on the test. if a student is chosen at random and is found to be a girl, the probability that the student scored an ais
Answers: 2
Mathematics, 21.06.2019 22:10, Jenifermorales101
Write the function for the graph. (1.8) (0,4)
Answers: 3
Mathematics, 21.06.2019 23:00, cifjdhhfdu
If a company produces x units of an item at a cost of $35 apiece the function c=35x is a of the total production costs
Answers: 2
You know the right answer?
Which graph represents the solution set to the following system of linear inequalities?
y ≤ 2x + 7...
Questions in other subjects:

Physics, 10.10.2019 09:10


Social Studies, 10.10.2019 09:10


Biology, 10.10.2019 09:10
Mathematics, 10.10.2019 09:10
Social Studies, 10.10.2019 09:10


