
Mathematics, 11.06.2021 04:20 Yasminl52899
45 POINTS
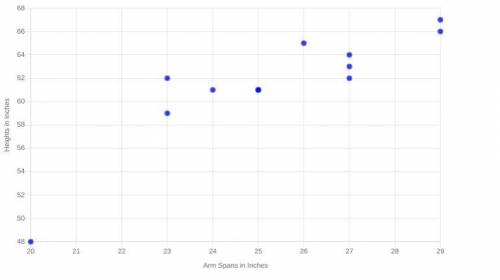
1) Which variable did you plot on the x-axis, and which variable did you plot on the y-axis? Explain why you assigned the variables in that way.
2) Write the equation of the line of best fit using the slope-intercept formula $y = mx + b$. Show all your work, including the points used to determine the slope and how the equation was determined.
3) What does the slope of the line represent within the context of your graph? What does the y-intercept represent?
4) Test the residuals of two other points to determine how well the line of best fit models the data.
5) Use the line of best fit to help you to describe the data correlation.
6) Using the line of best fit that you found in Part Three, Question 2, approximate how tall is a person whose arm span is 66 inches?
7) According to your line of best fit, what is the arm span of a 74-inch-tall person?

Answers: 3


Other questions on the subject: Mathematics
Mathematics, 21.06.2019 15:00, juju323261
With these: 18/36 = 1/? missing number change 1 5/8 to improper fraction. change 19/5 to a mixed number.
Answers: 1
Mathematics, 21.06.2019 23:30, jdenty3398
The graph of the the function f(x) is given below. find [tex]\lim_{x \to 0\zero} f(x)[/tex] [tex]\lim_{x \to 1+\oneplus} f(x)[/tex] [tex]\lim_{x \to 0-\zeroneg} f(x)[/tex]
Answers: 1
Mathematics, 22.06.2019 00:30, cassidyhead27
A10 inch cookie cake is divided into 8 slices. what is the area of 3 slices
Answers: 1
Mathematics, 22.06.2019 02:00, FaygoMango
Prove the following(cot0+cosec0)[tex](cot0 + cosec0) { }^{2} = \frac{1 + cos0}{1 - cos0} [/tex]
Answers: 1
You know the right answer?
45 POINTS
1) Which variable did you plot on the x-axis, and which variable did you plot on the y-ax...
Questions in other subjects:
Mathematics, 26.10.2020 16:40
Mathematics, 26.10.2020 16:40


