
Mathematics, 11.06.2021 02:40 crebflower
The midterm grades for two high school algebra classes are provided in the tables below. For convenience, the data have been ordered.
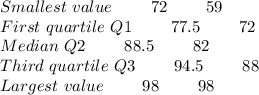
Class 1: 72 73 74 75 76 79 82 83 84 86 91
92 93 93 94 95 97 97 98 98
Class 2: 59 65 68 69 72 73 78 80 82 82
83 83 85 88 88 89 94 96 97 98
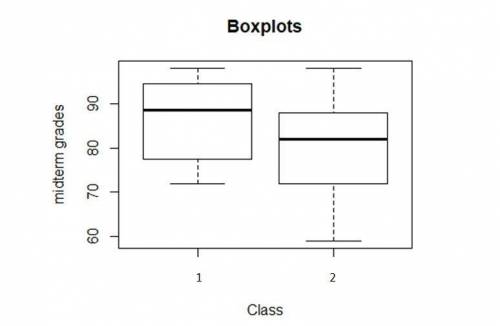
A. Sketch parallel boxplots for the two classes.
B. Which class has the better overall performance? Justify your answer.
C. The teacher for the two classes calculates a 90% confidence interval for the difference in mean midterm grades between Class #1 and Class #2. The confidence interval is (0.09299, 11.413). Assume that confidence interval conditions are met. Based on the confidence interval, do you think there is a difference in the population mean midterm grades for the two classes? Explain.

Answers: 1

![\to five\ num(Class\ 1) \\\\\[1\] \ 72.0 77.5 88.5 94.5 98.0 \\\\\to five\ num(Class\ 2) \\\\\[1\]\ 59 72 82 88 98](/tpl/images/1370/9176/1347a.png)

 Please find the graph file.
![mean \ (Class \ 1) \\\\\[1\]\ 86.5\\\\mean\ (Class\ 2)\\\\](/tpl/images/1370/9176/e867d.png)
![\[ 1 \] \ 80.80952\\\\Difference = 86.5 - 80.80952 = 5.69048](/tpl/images/1370/9176/ba743.png)


Other questions on the subject: Mathematics
Mathematics, 21.06.2019 18:30, jacksonhoyt8049
Can someone me do math because i am having a breakdown rn because i don’t get it
Answers: 1
Mathematics, 21.06.2019 19:50, leximae2186
The graph shows the distance kerri drives on a trip. what is kerri's speed?
Answers: 3
Mathematics, 21.06.2019 20:00, JOEFRESH10
The table shows the age and finish time of ten runners in a half marathon. identify the outlier in this data set. drag into the table the ordered pair of the outlier and a reason why that point is an outlier.
Answers: 1
You know the right answer?
The midterm grades for two high school algebra classes are provided in the tables below. For conveni...
Questions in other subjects:


English, 18.06.2020 01:57

History, 18.06.2020 01:57

History, 18.06.2020 01:57


