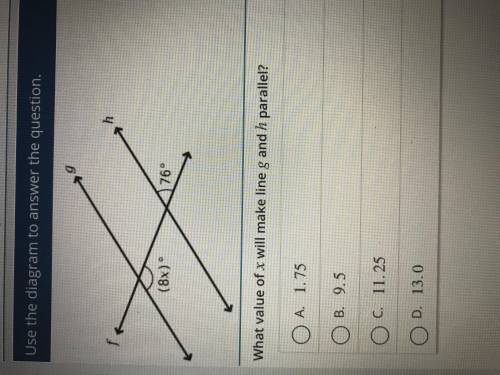
Which value of x will make line g and h parallel?
...

Mathematics, 10.06.2021 01:00 sierravick123owr441
Which value of x will make line g and h parallel?

Answers: 2


Other questions on the subject: Mathematics
Mathematics, 21.06.2019 14:30, paulinahunl17
The minimum wage in washington has been increasing over the last ten years. years 2000 2001 2002 2003 2004 2005 2006 2007 2008 2009 2010 washington state minimum wage $6.50 $6.72 $6.90 $7.01 $7.16 $7.35 $7.63 $7.93 $8.07 $8.55 $8.55 a) find the linear regression equation for the minimum wage in washington using this data ( x 0 in 2000). round to the thousandths. b) what is the slope? specifically, what does the slope represent in the real world context? c) what is the y-intercept? specifically, what does the y-intercept represent in the real world context? d) write your equation as a function of x. e) if you do not earn a college degree and you are earning minimum wage in 2020, what do you predict you will be earning per hour with the linear regression equation? f) if the trend continues, when will the minimum wage be $15 an hour? 3. why are your answers to #1d and #2a above different? which do you think is more accurate (#1 or #2) and why
Answers: 1
Mathematics, 21.06.2019 16:00, kell22wolf
Part one: measurements 1. measure your own height and arm span (from finger-tip to finger-tip) in inches. you will likely need some from a parent, guardian, or sibling to get accurate measurements. record your measurements on the "data record" document. use the "data record" to you complete part two of this project. name relationship to student x height in inches y arm span in inches archie dad 72 72 ginelle mom 65 66 sarah sister 64 65 meleah sister 66 3/4 67 rachel sister 53 1/2 53 emily auntie 66 1/2 66 hannah myself 66 1/2 69 part two: representation of data with plots 1. using graphing software of your choice, create a scatter plot of your data. predict the line of best fit, and sketch it on your graph. part three: the line of best fit include your scatter plot and the answers to the following questions in your word processing document 1. 1. which variable did you plot on the x-axis, and which variable did you plot on the y-axis? explain why you assigned the variables in that way. 2. write the equation of the line of best fit using the slope-intercept formula $y = mx + b$. show all your work, including the points used to determine the slope and how the equation was determined. 3. what does the slope of the line represent within the context of your graph? what does the y-intercept represent? 5. use the line of best fit to you to describe the data correlation.
Answers: 2
You know the right answer?
Questions in other subjects:

Business, 20.09.2019 20:30


Biology, 20.09.2019 20:30
Mathematics, 20.09.2019 20:30
Mathematics, 20.09.2019 20:30


