
Mathematics, 09.06.2021 23:40 morgantisch25
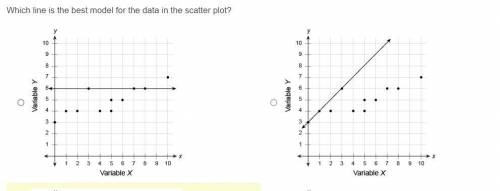
Which line is the best model for the data in the scatter plot?
Coordinate plane in the first quadrant. The x axis is labeled variable X and ranges from 0 to 10 in increments of 1. The y axis is labeled variable Y and ranges from 0 to 10 in increments of 1. The points on the graph are begin ordered pair 0 comma 3 end ordered pair, begin ordered pair 1 comma 4 end ordered pair, begin ordered pair 2 comma 4 end ordered pair, begin ordered pair 3 comma 6 end ordered pair, begin ordered pair 4 comma 4 end ordered pair, begin ordered pair 5 comma 4 end ordered pair, begin ordered pair 5 comma 5 end ordered pair, begin ordered pair 6 comma 5 end ordered pair, begin ordered pair 7 comma 6 end ordered pair, begin ordered pair 8 comma 6 end ordered pair, and begin ordered pair 10 comma 7 end ordered pair. A line is drawn through points begin ordered pair 3 comma 6 end ordered pair, begin ordered pair 7 comma 6 end ordered pair, and begin ordered pair 8 comma 6 end ordered pair.
Coordinate plane in the first quadrant. The x axis is labeled variable X and ranges from 0 to 10 in increments of 1. The y axis is labeled variable Y and ranges from 0 to 10 in increments of 1. The points on the graph are begin ordered pair 0 comma 3 end ordered pair, begin ordered pair 1 comma 4 end ordered pair, begin ordered pair 2 comma 4 end ordered pair, begin ordered pair 3 comma 6 end ordered pair, begin ordered pair 4 comma 4 end ordered pair, begin ordered pair 5 comma 4 end ordered pair, begin ordered pair 5 comma 5 end ordered pair, begin ordered pair 6 comma 5 end ordered pair, begin ordered pair 7 comma 6 end ordered pair, begin ordered pair 8 comma 6 end ordered pair, and begin ordered pair 10 comma 7 end ordered pair. A line is drawn through points begin ordered pair 0 comma 3 end ordered pair, begin ordered pair 1 comma 4 end ordered pair, and begin ordered pair 3 comma 6 end ordered pair.
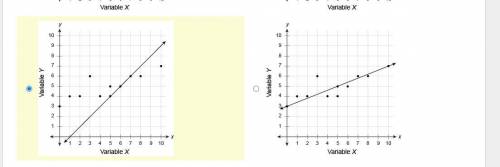
Coordinate plane in the first quadrant. The x axis is labeled variable X and ranges from 0 to 10 in increments of 1. The y axis is labeled variable Y and ranges from 0 to 10 in increments of 1. The points on the graph are begin ordered pair 0 comma 3 end ordered pair, begin ordered pair 1 comma 4 end ordered pair, begin ordered pair 2 comma 4 end ordered pair, begin ordered pair 3 comma 6 end ordered pair, begin ordered pair 4 comma 4 end ordered pair, begin ordered pair 5 comma 4 end ordered pair, begin ordered pair 5 comma 5 end ordered pair, begin ordered pair 6 comma 5 end ordered pair, begin ordered pair 7 comma 6 end ordered pair, begin ordered pair 8 comma 6 end ordered pair, and begin ordered pair 10 comma 7 end ordered pair. A line is drawn through points begin ordered pair 5 comma 4 end ordered pair, begin ordered pair 6 comma 5 end ordered pair, and begin ordered pair 7 comma 6 end ordered pair.
Coordinate plane in the first quadrant. The x axis is labeled variable X and ranges from 0 to 10 in increments of 1. The y axis is labeled variable Y and ranges from 0 to 10 in increments of 1. The points on the graph are begin ordered pair 0 comma 3 end ordered pair, begin ordered pair 1 comma 4 end ordered pair, begin ordered pair 2 comma 4 end ordered pair, begin ordered pair 3 comma 6 end ordered pair, begin ordered pair 4 comma 4 end ordered pair, begin ordered pair 5 comma 4 end ordered pair, begin ordered pair 5 comma 5 end ordered pair, begin ordered pair 6 comma 5 end ordered pair, begin ordered pair 7 comma 6 end ordered pair, begin ordered pair 8 comma 6 end ordered pair, and begin ordered pair 10 comma 7 end ordered pair. A line is drawn through points begin ordered pair 0 comma 3 end ordered pair, begin ordered pair 5 comma 5 end ordered pair, and begin ordered pair 10 comma 7 end ordered pair.

Answers: 2


Other questions on the subject: Mathematics
Mathematics, 21.06.2019 17:00, nisazaheer
Determine the number of outcomes in the event. decide whether the event is a simple event or not. upper a computer is used to select randomly a number between 1 and 9 comma inclusive. event upper b is selecting a number greater than 4. event upper b has nothing outcome(s). is the event a simple event? (yes or no) because event upper b has (fewer than, exactly, more than) one outcome.
Answers: 1
Mathematics, 21.06.2019 19:00, amanda2517
To solve the system of equations below, pedro isolated the variable y in the first equation and then substituted it into the second equation. what was the resulting equation? { 5y=10x {x^2+y^2=36
Answers: 1
Mathematics, 21.06.2019 22:00, Morehollie9428
Type the correct answer in the box. consider the system of linear equations below. rewrite one of the two equations above in the form ax + by = c, where a, b, and c are constants, so that the sum of the new equation and the unchanged equation from the original system results in an equation in one variable.
Answers: 2
You know the right answer?
Which line is the best model for the data in the scatter plot?
Coordinate plane in the first quadra...
Questions in other subjects:
Mathematics, 23.07.2019 23:30

Chemistry, 23.07.2019 23:30


