
Mathematics, 09.06.2021 02:20 c4thegoat
Please help with this, will give brainliest.
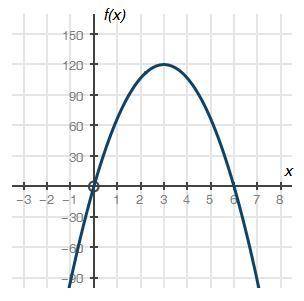
The graph below shows a company's profit f(x), in dollars, depending on the price of pens x, in dollars, being sold by the company:
graph of quadratic function f of x having x intercepts at ordered pairs 0, 0 and 6, 0. The vertex is at 3, 120
Part A: What do the x-intercepts and maximum value of the graph represent? What are the intervals where the function is increasing and decreasing, and what do they represent about the sale and profit? (6 points)
Part B: What is an approximate average rate of change of the graph from x = 3 to x = 5, and what does this rate represent? (4 points)
(10 points)

Answers: 2


Other questions on the subject: Mathematics
Mathematics, 21.06.2019 17:50, amcdonald009
To solve the system of equations below, grace isolated the variable y in the first equation and then substituted into the second equation. what was the resulting equation? 3y=12x x^2/4+y^2/9=1
Answers: 1
Mathematics, 21.06.2019 22:00, michelle7511
The evening newspaper is delivered at a random time between 5: 30 and 6: 30 pm. dinner is at a random time between 6: 00 and 7: 00 pm. each spinner is spun 30 times and the newspaper arrived 19 times before dinner. determine the experimental probability of the newspaper arriving before dinner.
Answers: 1
You know the right answer?
Please help with this, will give brainliest.
The graph below shows a company's profit f(x), in doll...
Questions in other subjects:


Chemistry, 22.01.2020 22:31
Mathematics, 22.01.2020 22:31

English, 22.01.2020 22:31


