
Mathematics, 07.06.2021 19:10 IsabelAyshi
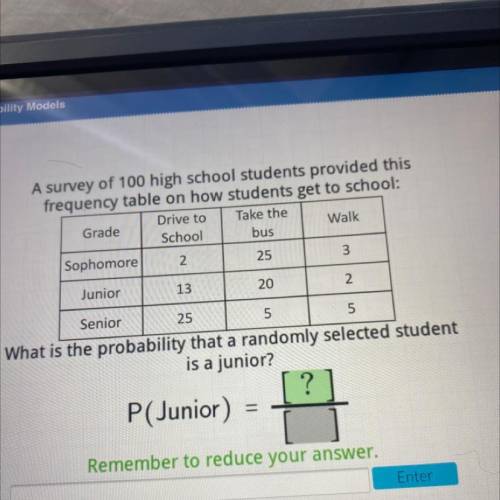
A survey of 100 high school students provided this
frequency table on how students get to school:
Drive to
Take the
Grade
Walk
School
bus
Sophomore
2
25
3
Junior
13
20
2
Senior
25
5
5
What is the probability that a randomly selected student
is a junior?
P(Junior)
Remember to reduce your answer.

Answers: 1


Other questions on the subject: Mathematics
Mathematics, 21.06.2019 18:00, briseidam6683
Suppose sat writing scores are normally distributed with a mean of 497 and a standard deviation of 109. a university plans to award scholarships to students whose scores are in the top 2%. what is the minimum score required for the scholarship? round your answer to the nearest whole number, if necessary.
Answers: 2
You know the right answer?
A survey of 100 high school students provided this
frequency table on how students get to school:
Questions in other subjects:
Mathematics, 04.01.2020 07:31


Mathematics, 04.01.2020 07:31

Geography, 04.01.2020 07:31


