This probability distribution shows the
typical grade distribution for a Geometry
course with...

Mathematics, 07.06.2021 06:50 nickp1233
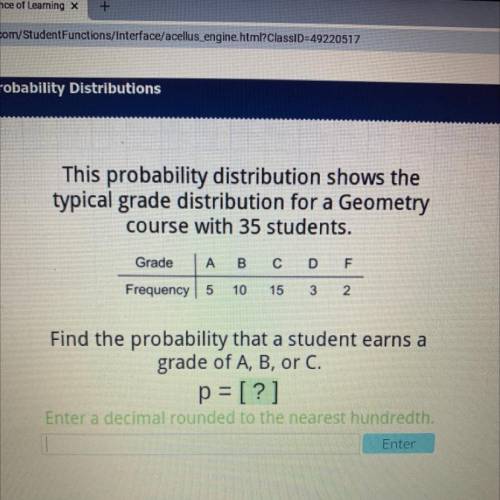
This probability distribution shows the
typical grade distribution for a Geometry
course with 35 students.
Grade
A
B
с
D
F
Frequency 5
10
15
3
N
Find the probability that a student earns a
grade of A, B, CN C.
p = [?]
Enter a decimal rounded to the nearest hundredth.

Answers: 2


Other questions on the subject: Mathematics
Mathematics, 21.06.2019 19:50, dalejacksoniip5yf4y
Which of the following describes the graph of y--4x-36 compared to the parent square root function? stretched by a factor of 2, reflected over the x-axis, and translated 9 units right stretched by a factor of 2, reflected over the x-axis, and translated 9 units left stretched by a factor of 2, reflected over the y-axis, and translated 9 units right stretched by a factor of 2, reflected over the y-axis, and translated 9 units left save and exit next submit
Answers: 1
Mathematics, 21.06.2019 21:10, elnkun98owvaa6
The equation |pl = 2 represents the total number of points that can be earned or lost during one turn of a game. which best describes how many points can be earned or lost during one turn? o o -2 2 oor 2 -2 or 2 o
Answers: 1
You know the right answer?
Questions in other subjects:

Mathematics, 08.03.2021 22:40

Mathematics, 08.03.2021 22:40
Mathematics, 08.03.2021 22:40
Mathematics, 08.03.2021 22:40


