
Mathematics, 05.06.2021 05:20 dlr1628
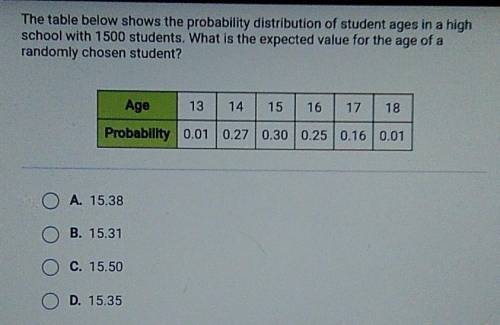
The table below shows the probability distribution of student ages in a high school with 1500 students. What is the expected value for the age of a randomly chosen student? Age 13 14 15 16 17 18 Probability 0.01 0.27 0.30 0.25 0.16 0.01 O A. 15.38 OB. 15.31 O C. 15.50 D. 15.35 SUBNET

Answers: 3


Other questions on the subject: Mathematics
Mathematics, 21.06.2019 14:50, alexis1246
What is the volume of the sphere shown below with a radius of 3?
Answers: 1
Mathematics, 21.06.2019 18:00, joseroblesrivera123
Since opening night, attendance at play a has increased steadily, while attendance at play b first rose and then fell. equations modeling the daily attendance y at each play are shown below, where x is the number of days since opening night. on what day(s) was the attendance the same at both plays? what was the attendance? play a: y = 8x + 191 play b: y = -x^2 + 26x + 126
Answers: 1
You know the right answer?
The table below shows the probability distribution of student ages in a high school with 1500 studen...
Questions in other subjects:


Biology, 16.09.2019 04:40

English, 16.09.2019 04:40


