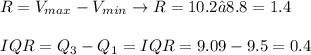
The box plots represent the distances run by the players in a football match.
Team B
8.7 88 8...

Mathematics, 04.06.2021 18:50 fantasticratz2
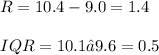
The box plots represent the distances run by the players in a football match.
Team B
8.7 88 89 90 91 92 93 9.4 0.5 0.6 0.7 08 09 10.0 10.1 10.2 10.3 10.4
Distance run (km)
The players in Team A ran more consistent distances.
How do the box plots show this?
(Total 1 mark)


Answers: 2


Other questions on the subject: Mathematics
Mathematics, 20.06.2019 18:04, KrishnaBalaram1235
Do u just plot the numbers on the graph like (1,
Answers: 2
Mathematics, 21.06.2019 16:20, tmantooth7018
The lengths of nails produced in a factory are normally distributed with a mean of 4.91 centimeters and a standard deviation of 0.05 centimeters. find the two lengths that separate the top 4% and the bottom 4%. these lengths could serve as limits used to identify which nails should be rejected. round your answer to the nearest hundredth, if necessary.
Answers: 3
You know the right answer?
Questions in other subjects:


Mathematics, 12.08.2020 06:01


