
Mathematics, 02.06.2021 21:20 jjhagan22
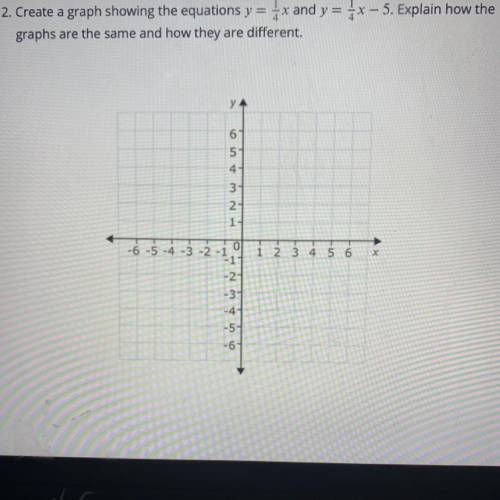
Create a graph showing the equations y = 1x and y = 3x – 5. Explain how the graphs are the same and how they are different.

Answers: 1


Other questions on the subject: Mathematics
Mathematics, 21.06.2019 20:00, aliahauyon20
The rectangle shown has a perimeter of 108 cm and the given area. its length is 6 more than five times its width. write and solve a system of equations to find the dimensions of the rectangle.
Answers: 3
Mathematics, 22.06.2019 01:50, mynameisjeff1417
According to a study done by de anza students, the height for asian adult males is normally distributed with an average of 66 inches and a standard deviation of 2.5 inches. suppose one asian adult male is randomly chosen. let x = height of the individual. a) give the distribution of x. x ~ b) find the probability that the person is between 64 and 69 inches. write the probability statement. what is the probability?
Answers: 2
Mathematics, 22.06.2019 03:40, cherylmorton7302
Anull hypothesis states that the difference between 8 hours of sleep and 3 hours of sleep has no effect on the number of pictures a student will remember during a picture memory interface test (pmit). examining the mit database, an extremely small t-value of 0.1611 is found. this t-value is much smaller than the smallest t-value on the chart for p-value reference. from this information we can: select one: a. accept the null hypothesis because the p-value obtained shows that the difference between the two groups being tested is not statistically significant b. accept the null hypothesis because the p-value obtained was statistically significant c. reject the null hypothesis because of the p-value obtained d. reject the null hypothesis because the data obtained is statistically significant
Answers: 3
You know the right answer?
Create a graph showing the equations y = 1x and y = 3x – 5. Explain how the
graphs are the same and...
Questions in other subjects:
Mathematics, 05.11.2020 21:20

Mathematics, 05.11.2020 21:20

Social Studies, 05.11.2020 21:20

Mathematics, 05.11.2020 21:20


